

July 1, 2022
Melanie Foster
Air Quality Division
Oklahoma Department of Environmental Quality
P.O. Box 1677
Oklahoma City, OK 73101-1677
Re: Public Comments of Conservation Organizations on Oklahoma’s Draft Regional Haze State Implementation Plan for the Second Period
Dear Ms. Foster:
Please accept these public comments submitted jointly by the Coalition to Protect America’s National Parks, National Parks Conservation Association and Sierra Club (together the “Conservation Organizations”) on Oklahoma’s Draft Regional Haze State Implementation Plan for the Second Planning Period (the “Draft SIP”) dated June 1, 2022. The Conservation Organizations thank the Oklahoma Department of Environmental Quality (“ODEQ”) in advance for its consideration of these comments.
The Coalition to Protect America’s National Parks (“Coalition”) is a non-profit organization composed of over 2,100 retired, former and current employees of the National Park Service (NPS). The Coalition studies, speaks, and acts for the preservation of America’s National Park System. As a group, we collectively represent over 40,000 years of experience managing and protecting America’s most precious and important natural, cultural, and historic resources.
National Parks Conservation Association (“NPCA”) is a national organization whose mission is to protect and enhance America’s national parks for present and future generations. NPCA performs its work through advocacy and education, with its main office in Washington, D.C. and 24 regional and field offices. NPCA has over 1.7 million members and supporters nationwide, with more than 14,600 in Oklahoma. NPCA is active nationwide in advocating for strong air quality requirements to protect our parks, including submission of petitions and comments relating to visibility issues, regional haze State Implementation Plans, climate change and mercury impacts on parks, and emissions from individual power plants and other sources of pollution affecting national parks and communities. NPCA’s members live near, work at, and recreate in all the national parks, including those directly affected by emissions from Oklahoma’s sources.
Sierra Club is a national nonprofit organization with 67 chapters across every state and more than 646,000 members, including more than 3,200 in Oklahoma. Sierra Club is dedicated to exploring, enjoying, and protecting the wild places of the earth; to practicing and promoting the responsible use of the earth’s ecosystems and resources; to educating and enlisting humanity to protect and restore the quality of the natural and human environment; and to using all lawful means to carry out these objectives. Sierra Club has long participated in regional haze rulemakings and related litigation across the country, in order to advocate for public health and for our nation’s public lands.
As explained in detail below, the Conservation Organizations have serious concerns regarding ODEQ’s Draft SIP. In order to conform to the letter as well as the policy of applicable regional haze law, ODEQ must address the errors, flaws, and omissions in the Draft SIP addressed in the body of these comments. Those errors, flaws and omissions include (but are not limited to):
- ODEQ has not sought or disclosed sufficient data to document the determinations underlying its SIP;
- ODEQ has not adequately addressed the impacts of transboundary emissions originating in Texas;
- ODEQ has arbitrarily excluded sources of pollution from its control analysis, including area sources and BART sources; and
- ODEQ has prescribed insufficient pollution controls for those sources it has considered, relying on an unreasonable Q/d threshold, as well as incorrect cost and control data.
As it currently stands, ODEQ’s Draft SIP does not meet the legal requirements of the Clean Air Act or federal regulations, and therefore cannot be approved by the U.S. Environmental Protection Agency (“EPA”). We urge ODEQ to revise the plan to address the fundamental flaws identified in these comments.
The Conservation Organizations appreciate ODEQ’s consideration. We welcome a dialogue in the event ODEQ has any questions or otherwise would like to discuss ways to improve the Draft SIP.
1 Legal Framework
1.1. The Clean Air Act’s Visibility Provisions and the Regional Haze Rule
The Clean Air Act establishes “as a national goal the prevention of any future, and the remedying of any existing, impairment of visibility in mandatory class I Federal areas which impairment results from manmade air pollution.” 42 U.S.C. § 7491(a)(1). To that end, EPA issued the Regional Haze Rule, which requires the states (or EPA where a state fails to act) to make incremental, “reasonable progress” toward eliminating human-caused visibility impairment at each Class I area by 2064. 40 C.F.R. § 51.308(d)(1), (d)(3). Together, the Clean Air Act and EPA’s Regional Haze Rule require states to periodically develop and implement state implementation plans (“SIPs”), each of which must contain a long-term strategy encompassing enforceable “emission limits, schedules of compliance and other measures as may be necessary to make reasonable progress toward the national goal.” 42 U.S.C. § 7491(b)(2); see also 42 U.S.C. § 7410(a)(2); 40 C.F.R. § 51.308.
In developing its long-term strategy, a state must consider all anthropogenic sources of visibility impairment and evaluate different emission reduction strategies, including but not limited to those prescribed by the BART provisions.140 C.F.R. § 51.308(f). A state should consider “major and minor stationary sources, mobile sources and area sources.”2Id. § 51.308(f)(2)(i). At a minimum, a state must consider the following factors in developing its long-term strategy:
(A) Emission reductions due to ongoing air pollution control programs, including measures to address reasonably attributable visibility impairment;
(B) Measures to mitigate the impacts of construction activities;
(C) Emissions limitations and schedules for compliance to achieve the reasonable progress goal;
(D) Source retirement and replacement schedules;
(E) Smoke management techniques for agriculture and forestry management purposes including plans as currently exist within the State for these purposes;
(F) Enforceability of emission limitations and control measures; and
(G) The anticipated net effect on visibility due to projected changes in point, area, and mobile emissions over the period addressed by the long-term strategy.3Id. § 51.308(f)(2)(iv).
Additionally, a state:
Must include in its implementation plan a description of the criteria it used to determine which sources or groups of sources it evaluated and how the four factors were taken into consideration in selecting the measures for inclusion in its long-term strategy.440 C.F.R. § 51.308(f)(2)(i).
In developing its plan, the state must document the technical basis for the SIP, including monitoring data, modeling, and emission information, including the baseline emission inventory upon which its strategies are based.540 C.F.R. § 51.308(f)(2)(i). All of this information is part of a state’s revised SIP and subject to public notice and comment. A state’s reasonable progress analysis must consider the four factors identified in the Clean Air Act and regulations. See 42 U.S.C. § 7491(g)(1); 40 C.F.R. § 51.308(f)(2)(i) (“the costs of compliance, the time necessary for compliance, the energy and non-air quality environmental impacts of compliance, and the remaining useful life of any potentially affected anthropogenic source of visibility impairment.”).
Notably, the statute does not list visibility improvement as a fifth factor in the reasonable progress analysis, and in implementing those statutory factors, EPA has made clear that it is not appropriate to reject a cost-effective control measures based on purportedly insufficient visibility benefits. In determining whether each state’s haze plan satisfies the statutory mandate to make reasonable progress, EPA reviews adherence to the above-mentioned criteria and whether the state follows the requirements to consult with other states and federal land managers, and reasonably considers the four statutory factors for reasonable progress. 40 C.F.R. §§ 51.308(d)(1)(iii)-(iv); (d)(3); (f).
1.2. EPA’s 2017 Revisions to the Regional Haze Rule
On January 10, 2017, the EPA revised the Regional Haze Rule to strengthen and clarify the reasonable progress and consultation requirements of the rule. See generally 82 Fed. Reg. 3078. In particular, the rule revisions make clear that states are to first conduct the required four-factor analysis for its sources, considering the four statutory factors, and then use the results from its four-factor analyses and determinations to develop the reasonable progress goals.682 Fed. Reg. 3,078, 3,090-91 (Jan. 10, 2017). Thus, the rule “codif[ies]” EPA’s “long-standing interpretation” of the SIP “planning sequence” States are required to follow:
(1) [C]alculate baseline, current and natural visibility conditions, progress to date and the [Uniform Rate of Progress] URP;
2) [D]evelop a long-term strategy for addressing regional haze by evaluating the four factors to determine what emission limits and other measures are necessary to make reasonable progress;
(3) [C]onduct regional-scale modeling of projected future emissions under the long-term strategies to establish RPGs and then compare those goals to the URP line; and
(4) [A]dopt a monitoring strategy and other measures to track future progress and ensure compliance.7Id. at 3,091.
Thus, the Regional Haze Rule makes clear that a state must conduct four-factor analysis and cannot rely on uniform rate of progress as an excuse for failing to perform the core functions of the law:
The CAA requires states to determine what emission limitations, compliance schedules and other measures are necessary to make reasonable progress by considering the four factors. The CAA does not provide that states may then reject some control measures already determined to be reasonable if, in the aggregate, the controls are projected to result in too much or too little progress. Rather, the rate of progress that will be achieved by the emission reductions resulting from all reasonable control measures is, by definition, a reasonable rate of progress. … [I]f a state has reasonably selected a set of sources for analysis and has reasonably considered the four factors in determining what additional control measures are necessary to make reasonable progress, then the state’s analytical obligations are complete if the resulting RPG for the most impaired days is below the URP line. The URP is not a safe harbor, however, and states may not subsequently reject control measures that they have already determined are reasonable.8Id. at 3,093 (emphasis added).
Moreover, for each Class I area within its borders, a state must determine the uniform rate of progress, which is the amount of progress that, if kept constant each year, would ensure that natural visibility conditions are achieved in 2064. 40 C.F.R. § 51.308(d)(1)(i)(B). If a state establishes reasonable progress goals that provide for a slower rate of improvement in visibility than the uniform rate of progress, the state must provide a technically “robust” demonstration, based on a careful consideration of the statutory reasonable progress factors, that there are no additional emission reduction measures for anthropogenic sources or groups of sources” that can reasonably be anticipated to contribute to visibility impairment in affected Class I areas.940 C.F.R. § 51.308 (f)(2)(ii)(A).
Although many states addressed the Clean Air Act’s BART requirements in their initial regional haze plans, EPA’s 2017 revisions to the Regional Haze Rule make clear that BART was not a once-and-done requirement. Indeed, states “will need” to reassess “BART-eligible sources that installed only moderately effective controls (or no controls at all)” for any additional technically-achievable controls in the second planning period.1082 Fed. Reg. at 3,083; see also id. at 3,096 (“states must evaluate and reassess all elements required by 40 CFR 51.308(d)”).
To the extent that a state declines to evaluate additional pollution controls for any source relied upon to achieve reasonable progress based on that source’s planned retirement or decline in utilization, it must incorporate those operating parameters or assumptions as enforceable limitations in the second planning period SIP. The Clean Air Act requires that “[e]ach state implementation plan . . . shall” include “enforceable limitations and other control measures” as necessary to “meet the applicable requirements” of the Act. 42 U.S.C. § 7410(a)(2)(A). The Regional Haze Rule similarly requires each state to include “enforceable emission limitations” as necessary to ensure reasonable progress toward the national visibility goal.11See 40 C.F.R. § 51.308(d)(3) (“ establishes If a state improvement in visibility than the uniform rate of progress, demonstration that “there are no additional emission reduction measures for anthropogenic sources or groups of sources” that can reasonably be anticipated contribute to visibility impairment in affected Class I areas.9 The long-term strategy must include enforceable emissions limitations, compliance schedules, and other measures as necessary to achieve the reasonable progress goals established by States having mandatory Class I Federal areas.”). Therefore, where the state relies on a sources’ plans to permanently cease operations or projects that future operating parameters (e.g., limited hours of operation or capacity utilization) will differ from past practice, or if this projection exempts additional pollution controls as necessary to ensure reasonable progress, then the state “must” make those parameters or assumptions into enforceable limitations.1240 C.F.R. §§ 51.308(i); (d)(3) (“The long-term strategy must include enforceable emissions limitations, compliance schedules . . .”); (f)(2) (the long-term strategy must include “enforceable emissions limitations”); see also Memorandum from Peter Tsirigotis, Director at EPA Office of Air Quality Planning and Standards, to EPA Air Division Directors Regions, “Guidance on Regional Haze State Implementation Plans for the Second Implementation Period,” EPA-457/B-19-003, at 22 (Aug. 2019), https://www.epa.gov/sites/production/files/2019- 08/documents/8-20-2019_-_regional_haze_guidance_final_guidance.pdf. [“2019 Guidance”] (“in selecting sources for control measure analysis,” the state may choose “not selecting sources that have an enforceable commitment to be retired or replaced by 2028”); id. at 34 (To the extent a retirement or reduction in operation “is being relied upon for a reasonable progress determination, the measure would need to be included in the SIP and/or be federally enforceable.”) (citing 40 C.F.R. § 51.308(f)(2)); 2019 Guidance at 43 (“[i]f a state determines that an in-place emission control at a source is a measure that is necessary to make reasonable progress and there is not already an enforceable emission limit corresponding to that control in the SIP, the state is required to adopt emission limits based on those controls as part of its long-term strategy in the SIP via the regional haze second planning period plan submission.”).
Finally, the state’s SIP revisions must meet certain procedural and consultation requirements.13For example, in addition to the Regional Haze Rule requirements, states must also follow the SIP processing requirements in 40 C.F.R. §§ 51.104, 51.102. The state must consult with the Federal Land Managers (“FLMs”) and look to the FLMs’ expertise of the lands and knowledge of the way pollution harms them to guide the state to ensure SIPs do what they must to help restore natural skies. The rule also requires that in “developing any implementation plan (or plan revision) or progress report, the State must include a description of how it addressed any comments provided by the Federal Land Managers.”14 Id. § 51.308(i)(3).
1.3. EPA’s July 8, 2021 Regional Haze Clarification Memorandum
On July 8, 2021, EPA issued a memo which further clarified certain aspects of the revised Regional Haze Rule and provided further information to states and EPA regional offices regarding their planning obligations for the Second Planning Period.15July 8, 2021 Memo from Peter Tsirogotis to Regional Air Directors, Clarifications Regarding Regional Haze State Implementation Plans for the Second Implementation Period at 3, https://www.epa.gov/visibility/clarifications- regarding-regional-haze-state-implementation-plans-second-implementation [hereinafter, “2021 Clarification Memo”]. EPA’s July 2021 “Clarification Memo” confirms that certain aspects of ODEQ’s proposed SIP are fundamentally flawed and cannot be approved. Particularly relevant here, EPA made clear that States must secure additional emission reductions that build on progress already achieved; there is an expectation that reductions are additive to ongoing and upcoming reductions under other CAA programs.16Id. at 2. In evaluating sources for emission reductions, EPA emphasized that:
Source selection is a critical step in states’ analytical processes. All subsequent determinations of what constitutes reasonable progress flow from states’ initial decisions regarding the universe of pollutants and sources they will consider for the second planning period. States cannot reasonably determine that they are making reasonable progress if they have not adequately considered the contributors to visibility impairment. Thus, while states have discretion to reasonably select sources, this analysis should be designed and conducted to ensure that source selection results in a set of pollutants and sources the evaluation of which has the potential to meaningfully reduce their contributions to visibility impairment.17Id. at 3.
Thus, it is generally not reasonable to exclude from further evaluation large sources or entire sectors of visibility impairing pollution. Moreover, the Clarification Memo reiterates that the fact that a Class I area is meeting the Uniform Rate of Progress is “not a safe harbor” and does not excuse the state from its obligation to consider the statutory reasonable progress factors in evaluating reasonable control options.18Id. at 2.
For sources that have previously installed controls, states should still evaluate the “full range of potentially reasonable options for reducing emissions,” including options that may “achieve greater control efficiencies, and, therefore, lower emission rates, using their existing measures.”19Id. at 7. Moreover, “[i]f a state determines that an in-place emission control at a source is a measure that is necessary to make reasonable progress and there is not already an enforceable emission limit corresponding to that control in the SIP, the state is required to adopt emission limits based on those controls as part of its long-term strategy in the SIP via the regional haze second planning period plan submission.”20Id. at 8 This means that so-called “on-the-way” measures, including anticipated shutdowns or reductions in a source’s emissions or utilization, that are relied upon to forgo a four-factor analysis or to shorten the remaining useful life of a source “must be included in the SIP” as enforceable emission reduction measures.21Id. at 8-9 (emphasis added). In addition, the Clarification Memo makes clear that a state should generally not reject cost-effective and otherwise reasonable controls merely because there have been emission reductions since the first planning period owing to other ongoing air pollution control programs or merely because visibility is otherwise projected to improve at Class I areas. Finally, the Clarification Memo confirms EPA’s recommendation that states take into consideration environmental justice concerns and impacts in issuing any SIP revision for the second planning period.
In sum, EPA’s 2021 Clarification Memo makes clear that the states’ regional haze plans for the second planning period must include meaningful emission reductions to make reasonable progress towards the national goal of restoring visibility in Class I areas. The Clarification Memo confirms that ODEQ’s efforts to avoid emission reductions—by asserting, for example, that reductions are not necessary because visibility has improved, because reductions are anticipated at some later date or due to implementation of another program, or because a source has some level of control—is at odds with Oklahoma’s haze obligations under the Clean Air Act and the Regional Haze Rule itself.
2 ODEQ Has Not Sought or Made Available Critical Data Documentation Underlying its Draft SIP
For these comments, emissions and controls information for all EGUs were downloaded from EPA’s Air Markets Program Data (AMPD) website.22See https://ampd.epa.gov/ampd/. This information is compiled and assessed in spreadsheets that are included in this analysis. Additional information was obtained from the Energy Information Agency (EIA).23See https://www.eia.gov/electricity/data/eia923/ Lastly, the Title V permits for a number of units were reviewed.
2.1. ODEQ Must Include Unit-Level Emission Data in Its SIP
In preparation for these comments, the ODEQ was requested to provide (1) unit-specific emissions information for non-EGUs (or point to where that information is kept). ODEQ promptly provided that information, along with a number of Title V permits that were requested.
Knowing and verifying the emissions from each unit and the existing controls installed on the individual units at facilities emitting hundreds to thousands of tons of air pollution annually is a critical function of an air agency that must control the emissions from these sources under a variety of state and federal programs. With respect to the regional haze program, this information is necessary to (1) verify that the right units/processes at facilities have been identified to receive four-factor analyses and (2) verify that the emissions from these units used in cost-effective calculations are actually representative of expected future operations.
Therefore, although the information was promptly provided, the emissions data must be made a part of the Oklahoma Regional Haze SIP. Without this information, ODEQ cannot satisfy the documentation requirements of 40 CFR 51.308(f)(2)(iv), discussed later in these comments.
Title V permits are another essential tool, as they list all the emission limits for these units, along with testing requirements, controls, and vital information concerning the type and functioning of the units. Although the Title V permits were promptly supplied when requested, they are not downloadable from ODEQ’s site. Therefore, for the same reason, ODEQ must include this information in its SIP or provide an external link to that information.
2.2. ODEQ Must Demand Better Cost Data Documentation
In some cases, ODEQ correctly questioned source data, equipment life, interest rates, and other information related to the four-factor analyses provided by sources.24See “second request letters” in Appendix E.
In a few cases, ODEQ has noted that even if the information were corrected, it would not have changed its decision regarding the implementation of the controls in question. However, it appears that in most cases ODEQ has accepted the source’s explanations for its use of this data and information, even though doing so is demonstrably incorrect. Thus, ODEQ has failed to require that sources properly conduct cost-effectiveness calculations, as thoroughly documented in these comments.
In its 2017 revision to the Regional Haze Rule, EPA specifically emphasized the need for the proper documentation of this type of data:25See 82 FR 3096 (January 10, 2017).
We are changing proposed 40 CFR 51.308(f)(2)(iv), regarding documentation requirements, to be 40 CFR 51.308(f)(2)(iii) … to “document the technical basis, including modeling, monitoring, cost, engineering, and emissions information, on which the State is relying to determine the emission reduction measures that are necessary to make reasonable progress in each mandatory Class I area it affects.” The purpose of this provision is to require states to document all of the information on which they rely to develop their long-term strategies, which will primarily be information used to conduct the four-factor analysis. Therefore, in addition to modeling, monitoring and emissions information, we are making it explicit that states must also submit the cost and engineering information on which they are relying to evaluate the costs of compliance, the time necessary for compliance, the energy and non-air quality impacts of compliance and the remaining useful lives of sources.
The Regional Haze Guidance reinforces this point:26See Guidance on Regional Haze State Implementation Plans for the Second Implementation Period, EPA-457/B-19-003 August 2019. Page 32.
As part of meeting the requirement of the Regional Haze Rule for the state to document the cost and engineering information on which the State is relying to determine the emission reduction measures that are necessary to make reasonable progress (40 CFR 51.308(f)(2)(iii)), every source-specific cost estimate used to support an analysis of control measures must be documented in the SIP. If information about a source has been asserted to be confidential, we recommend the state consult with its EPA Regional office regarding whether such confidentiality is appropriate and allowed under the CAA and if so how it can be reconciled with the need for adequate documentation of the basis for the SIP.
ODEQ must therefore correct these fundamental failures in the documentation of its SIP. Unless these issues are addressed, ODEQ cannot satisfy Section 51.308(f) which requires “supporting documentation for all required analyses” or Section 51.308(f)(2)(iii) which requires that ODEQ “must document the technical basis, including modeling, monitoring, cost, engineering, and emissions information, on which the State is relying to determine the emission reduction measures that are necessary to make reasonable progress in each mandatory Class I Federal area it affects.”
3 ODEQ’s Consultation Documentation Is Inadequate
It appears that the only information on ODEQ’s consultation, other than the short summaries presented in Sections 6 and 8, appears in Appendix A. Appendix A contains links to some documents, including ODEQ’s letters to Texas, Nebraska, Arkansas, and Louisiana. There are no links to any of the reply letters. ODEQ’s consultation record is therefore incomplete.
The requirement in section 51.308(f)(2)(iii) to “document the technical basis, including modeling, monitoring, cost, engineering, and emissions information, on which the State is relying” extends to ODEQ’s consultation requirement, as consultation is intended to determine whether additional “emission reduction measures that are necessary to make reasonable progress” are necessary.
Additionally, without this information, ODEQ cannot demonstrate under section 51.308(f)(2(ii) that it “has included in its implementation plan all measures agreed to during state-to-state consultations or a regional planning process, or measures that will provide equivalent visibility improvement.” Therefore, ODEQ must fully present all responses to its letters that it received for other state agencies.
4 ODEQ Must Document the Impacts from Texas
Section 51.308(f)(2)(ii) requires that Oklahoma “consult with those states that have emissions that are reasonably anticipated to contribute to visibility impairment in the mandatory Class I Federal area ….” Therefore, in order to address this requirement, ODEQ must first establish which states do have such impacts and the magnitude of those impacts.
Despite the fact of the well-established impact of Texas sources on the Wichita Mountains during the first planning period, ODEQ pays scant attention to the subject in its SIP. In fact, it does not present any information concerning the actual impacts from Texas sources on the Wichita Mountains. Mainly, when it does mention Texas, it does so in the context of noting emission reductions that have occurred as a result of large point sources retiring. The exception to this is in reviewing its consultations with Texas: ODEQ there notes that it requested that Texas consider 15 sources to consider “for further analysis.”27See page 42.
Consequently, ODEQ must provide documentation of the scope and magnitude of the impacts that Texas sources have on the Wichita Mountains. For that matter, it must do the same for other states as well. Unless it provides that documentation, it cannot demonstrate that it has in fact satisfied the consultation requirement in section 51.308(f)(2)(ii).
5 ODEQ Should Have Insisted that Texas Reduce Its Emissions
On page 42, ODEQ summarizes its consultation with Texas:
On July 17, 2020, DEQ sent a letter to TCEQ requesting Texas consider the fifteen sources listed in Table 6-5 for further analysis and to continue to consult with DEQ regarding any resulting analyses or measures at the above-listed sources. On August 11, 2020, DEQ and TCEQ held a web conference during which TCEQ communicated its planned recommendations for Texas’s SIP. TCEQ’s photochemical modeling projected minimal visibility benefits from potentialcontrols on sources of interest. TCEQ concluded that further controls were not necessary to meet reasonable progress at affected Class I areas.
As indicated earlier in these comments, ODEQ has not presented any information that actually establishes the impact of Texas sources on the Wichita Mountains and must do so. Despite its failure to present that information, ODEQ obviously concluded that a number of sources in Texas have the potential to impact the Wichita Mountains. ODEQ’s failure to press Texas to control its sources abuses the spirit and intent of the consultation requirements in section 51.308(f)(2(ii).
6 Problems with ODEQ’s Source Selection
6.1. ODEQ Must Consider Area Sources
Section 40 CFR 51.308(f)(2)(i) indicates that states should consider evaluating major and minor stationary sources or groups of sources, mobile sources, and area sources. Table 4-3 indicates that nonpoint (area) sources are the top NOx emitters of any sector for ODEQ’s 2017 emission inventory. ODEQ also presents Figure 4-3, which is a pie chart depicting source-type contributions to the 2014 and 2017 NOx emission inventories, and Figure 4-4, which depicts sector contributions to the 2014 NOx emission inventory. It is unclear how Figure 4-4 relates to Figure 4-3. ODEQ must improve its presentation of its NOx emission inventory to (1) make it clear how much the oil and gas sector contributes and (2) the point and non-point source breakdown.
On page 21, ODEQ attributes the apparent increase in NOx area source contributions from 2014 to 2017, at least in part, to its improved and more accurate NOx emission inventory data gathering and accounting procedures. Regardless, it is apparent that NOx area source emissions, in particular those from the oil and gas sector, are quite significant. Because there does not appear to be any real consideration of how area sources could be analyzed and potentially controlled, it does not appear that ODEQ has satisfied section 51.308(f)(2)(i). ODEQ must therefore reexamine its source selection methodology to ensure it has properly considered area sources.
6.2. ODEQ Cannot Incorporate Resource Constraints into Its Regional Haze Decision Making
As indicated above, ODEQ does not properly assess NOx area sources. It provides the following explanation on page 22 for not doing so:
Where appropriate, larger oil and gas point sources have been evaluated for potential NOx controls during Planning Period 2. The sheer number of small oil and gas sources makes it extraordinarily inefficient and impracticable for ODEQ, a state agency with limited means, to evaluate each source individually for possible emission reductions.
Similarly, on page 30, ODEQ indicates that one of the reasons it chose to perform a separate source selection for NOx and SO2, instead of adopting the usual procedure of basing it on the combined effects of NOx and SO2, was because “given the resource intensity of conducting a four-factor analysis, DEQ focused on greater emissions of one pollutant, not split between moderate emissions of two pollutants.” Obviously, here, ODEQ adopted its split source selection strategy because it concluded it would result in fewer sources to evaluate, thus easing its resource burden.
Again, on page 36, ODEQ states that one of the reasons it did not subject sources that underwent a BART analysis in the first planning period to four-factor analyses was because “eliminating sources identified in the AOI study that underwent BART reduced the potential for expending valuable resources on analyzing sources with little opportunity for further reductions.”
ODEQ’s resource excuse for not properly considering NOx area sources, in particular those from the oil and gas sector and BART sources, is untenable. ODEQ must not base its source selection methodology on any type of resource consideration. First, as this is a state SIP, ODEQ is not solely responsible for mustering the resources necessary to complete the SIP. Therefore, if it requires additional resources, it should draw them from other state agencies. Second, the Clean Air Act, 42 U.S.C. §7410(a)(2)(E) requires that each SIP provide “necessary assurances that the State … will have adequate personnel, funding, and authority under State (and, as appropriate, local) law to carry out such implementation plan (and is not prohibited by any provision of Federal or State law from carrying out such implementation plan or portion thereof).28See https://www.govinfo.gov/content/pkg/USCODE-2013-title42/html/USCODE-2013-title42-chap85-subchapI-partA-sec7410.htm This requirement of the Clean Air Act ensures that states do not underfund their environmental agencies as an excuse for not adequately administering SIPs. Thus, ODEQ cannot base any aspect of its SIP on a lack of resources. If it doesn’t have adequate personnel or other resources in order to conduct a complete source selection and the resulting four-factor analyses, it is obligated to allocate and/or acquire those resources. ODEQ must therefore reexamine its source selection methodology in order to ensure that it has selected sources for four-factor analyses without regard to resource considerations.
6.3. ODEQ Cannot Give BART Sources a Blanket Exemption to Four-Factor Analyses
Beginning on page 35, ODEQ describes its rationale for excluding certain sources from four-factor analyses that otherwise met its single source selection methodology:
[T]hirteen emission units at six facilities were required, through either Oklahoma’s Planning Period 1 RH SIP or EPA’s FIP, to implement BART controls in conjunction with Planning Period 1. All thirteen emissions units reduced NOx emissions by installation of (or in some cases utilizing existing) low-NOx burners. For the six coal-fired BART units, existing PM controls were considered to meet BART requirements. BART SO2 requirements for these six units have been applied as follows: the four OG&E units have installed dry-gas desulfurization, one PSO unit was retired, and the other is applying dry-sorbent/carbon injection SO2 controls until its retirement in 2026. It is unlikely that a new four-factor analysis would result in a finding that additional cost-effective controls are available and appropriate for these emission units.
ODEQ simply concludes that the mere fact that the source in question received a BART evaluation in the first planning period is sufficient criteria for excluding it from a second planning period reasonable progress analysis. In a number of cases, such as the OG&E Muskogee Units 4 and 5, Sooner Station and the PSO Northeastern Station, its decision appears sound for SO2, as it is unlikely that a four-factor analysis would conclude that additional cost-effective controls for SO2 are available.29 In fact, in Sooner’s case the two units are exceeding their FIP required emissions limits and now demonstrate two of the best performing dry scrubbing systems in the United States. ODEQ should therefore ensure their permits are amended to reflect this level of performance.29Note this is not true for Muskogee Unit 6, as discussed in the next section. In fact, in Sooner’s case the two units are exceeding their FIP required emissions limits and now demonstrate two of the best performing dry scrubbing systems in the United States. ODEQ should therefore ensure their permits are amended to reflect this level of performance.
However, this same conclusion cannot be made for NOx for these sources, as none have any post-combustion NOx controls and remain large sources of NOx, even though some have switched to burning natural gas (Muskogee Units 4 and 5). Southwestern and Seminole are other examples.
ODEQ does not provide any documentation to demonstrate its assertion that these BART sources could not be further cost-effectively controlled. ODEQ’s blanket exemption of its BART sources conflicts with the Regional Haze Rule, as indicated by Section 51.308(e)(5), which states the following:
After a State has met the requirements for BART or implemented an emissions trading program or other alternative measure that achieves more reasonable progress than the installation and operation of BART, BART-eligible sources will be subject to the requirements of paragraphs (d) and (f) of this section, as applicable, in the same manner as other sources.
EPA further reinforces this requirement in its 2017 Regional Haze Rule revision:30See 82 FR 3083 (January 10, 2017).
The BART requirement was a one-time requirement, but a BART-eligible source may need to be re-assessed for additional controls in future implementation periods under the CAA’s reasonable progress provisions. Specifically, we anticipate that a number of BART-eligible sources that installed only moderately effective controls (or no controls at all) will need to be reassessed. Under the 1999 RHR’s 40 CFR 51.308(e)(5), BART-eligible sources are subject to the requirements of 40 CFR 51.308(d), which addresses regional haze SIP requirements for the first implementation period, in the same manner as other sources going forward.
It is very likely that a properly performed NOx four-factor analysis would conclude that cost-effective controls are available for a number of these and other sources that ODEQ wrongly excludes. Thus, ODEQ’s blanket BART exemption is likely illegal. ODEQ must properly assess the BART sources it has given an exemption to four-factor analyses.
6.4. ODEQ Must Evaluate Muskogee 6 for Cost-effective Controls
As indicated above, ODEQ provided Muskogee Station a blanket exemption from four-factor reviews because Units 4 and 5 had undergone BART analyses in the first round SIP review. The incorrectness of this general exemption aside, it certainly does not extend to Unit 6. Unit 6 did not undergo a BART analysis in the first planning period, as its construction date fell outside of the BART window. Although Units 4 and 5 have since switched to natural gas, at the time of the BART analyses, Units 4, 5, and 6 were essentially identical, all being 572 MW tangentially-fired Combustion Engineering boilers that burned coal.
According to information from EPA, Unit 6’s NOx control consists of overfire air with no post-combustion NOx controls and has no SO2 controls.31See https://ampd.epa.gov/ampd/. This information is compiled and assessed in spreadsheets that are included in this analysis. Just as Units 4 and 5 were evaluated for both NOx and SO2, Unit 6 should now be evaluated for NOx and SO2 in this planning period. Furthermore, there is no reason to conclude that the same controls that were found to be cost-effective for Units 4 and 5 in the first planning period would somehow cease to be cost-effective for Unit 6. Consequently, ODEQ must evaluate Muskogee Unit 6 for both SO2 and NOx controls.
6.5. ODEQ’s Source Selection Strategy Is Unsound, Undocumented, and Arbitrary
The discussion elsewhere in these comments concerning cost documentation also applies to ODEQ’s source selection strategy as well: 40 CFR 51.308(f)(2)(iii) requires that ODEQ “document the technical basis, including modeling, monitoring, cost, engineering, and emissions information, on which [it] is relying to determine the emission reduction measures that are necessary to make reasonable progress in each mandatory Class I area it affects.” As discussed below, ODEQ’s source selection strategy suffers from unsound and arbitrary decision making, and a lack of documentation.
6.5.1. ODEQ’s Single Pollutant Source Selection Reasoning Is Unsound
Beginning on page 30, ODEQ describes its source selection methodology. As indicated above, ODEQ did not adopt the usual procedure of selecting sources based on their combined NOx and SO2 impacts. Rather, ODEQ evaluated impacts by calculating Q/d separately for NOx and SO2, and provides the following justification for having done so on page 30:
When analyzing source contribution to visibility impairment, DEQ considered NOx and SO2 emissions separately instead of aggregating contributions from each pollutant for a total source contribution. Visibility impairment at the WMWA is clearly dominated by NOx in winter conditions and SO2 in most of the rest of the year (see Figures 3-2 and 3-3 in Section 3). If DEQ had considered the total contribution of a source from both NOx and SO2 together, the potential for visibility improvement by controlling aggregated emissions would not reasonably correspond with the MIDs identified through monitoring. Control options for NOx and SO2 vary widely, resulting in the possibility that controlling one, but not both, is cost effective. The visibility improvement from controlling one pollutant at a source identified through aggregate contribution would be far less than would be considered cost effective. Additionally, given the resource intensity of conducting a four-factor analysis, DEQ focused on greater emissions of one pollutant, not split between moderate emissions of two pollutants.
First, it is not unusual for one pollutant to seasonally impact visibility impacts at Class I Areas. In fact, this is the usual situation for many Class I Areas.
Second, ODEQ’s statement that this typical situation somehow justifies or supports its decision to separately evaluate NOx and SO2 because “the potential for visibility improvement by controlling aggregated emissions would not reasonably correspond with the MIDs [Most Impacted Days] identified through monitoring” is irrational. There is no requirement or view expressed anywhere in the Clean Air Act, the Regional Haze Rule, or guidance that source selection should be tied to seasonal pollutant visibility impacts. As ODEQ indicates in Figure 6-1, both ammonium nitrate and ammonium sulfate impact the WMWA fairly equally. In such a situation, it makes no difference whether one pollutant or the other dominates during particular times of the year: controlling either pollutant will improve annual visibility. Furthermore, the fact that NOx and SO2 both significantly impact visibility at the WMWA reinforces the need to perform source selection on the basis of “aggregated emissions.” ODEQ’s reference to the “the potential for visibility improvement by controlling aggregated emissions,” has no relationship to the source selection process or in fact cost-effectiveness analysis. Controls are almost always assessed on the basis of how much they control one pollutant.
ODEQ is correct that, “[c]ontrol options for NOx and SO2 vary widely, resulting in the possibility that controlling one, but not both pollutants, is cost effective.” Again, that is not unusual. States routinely select sources by considering both NOx and SO2 impacts together only to later find that only one or no pollutant controls turn out to be cost-effective. ODEQ’s off-handed consideration of it during source selection wrongly biases control analyses.
ODEQ’s next statement that “[t]he visibility improvement from controlling one pollutant at a source identified through aggregate contribution would be far less than would be considered cost effective” indicates a consideration that is also temporally out of order and thus biases the source selection process. ODEQ does not know at this stage of the process what controls may be cost-effective and what visibility improvement they may bring. In fact, ODEQ does not quantify the visibility improvement resulting from any of the controls it considers in any of its four-factor analyses, and thus has no basis on which to make this or similar statements.
In summary, all of ODEQ’s above statements are a red herring, deflecting attention from ODEQ’s apparent fundamental motivation, which it states at the end of the above quote: selecting sources by considering both NOx and SO2 together would result in more sources selected, which would result in a resource drain to ODEQ. As indicated above, this conflicts with the Clean Air Act. Therefore, ODEQ must revise its source selection strategy. Either ODEQ must provide a rational basis that justifies its decision to select sources by separatelyconsidering NOx and SO2, or ODEQ must selected sources on the basis of the combined impacts of NOx and SO2.
6.5.2. ODEQ’s Q/d Threshold Is Arbitrary
On page 32, ODEQ states that it began its source selection by identifying sources with a Q/d value of 5 tons per year per kilometer or greater, which as discussed above is based on separate calculations for NOx and SO2. ODEQ does not present any discussion or justification for selecting a Q/d threshold of 5. As indicated above, this does not satisfy the documentation requirement of 40 CFR 51.308(f)(2)(iii). ODEQ cannot satisfy this requirement due to its complete lack of any justification for selecting its Q/d threshold of 5. This is especially important because, as discussed above, ODEQ has separately calculated Q/d for NOx and SO2—an unusual strategy that should correspond to a lower Q/d value than that used by states using combined NOx and SO2 emissions, which ODEQ admits to having chosen due to resource constraints.
6.5.3. ODEQ’s Source Selection Threshold Is Arbitrary and Illegal
On page 32, ODEQ states that following elimination of sources from four-factor analyses based on its single pollutant Q/d source selection described above, it further eliminated sources by applying a 0.5% or greater contribution threshold based on dividing the Extinction Weighted Residence Time (EWRT) by the distance from WMWA to the source. ODEQ’s only justification for this additional threshold is expressed on page 33: “Given the successful reduction in visibility impairment over the last decade, 0.5% is an appropriate threshold for identifying sources of the greatest importance for further analysis.” In fact, this exceedingly thin justification is no justification at all, but a prohibited action under the Regional Haze Rule:3282 FR 3099 (January 10, 2017).
Treating the URP as a safe harbor would be inconsistent with the statutory requirement that states assess the potential to make further reasonable progress towards natural visibility goal in every implementation period. Even if a state is currently on or below the URP, there may be sources contributing to visibility impairment for which it would be reasonable to apply additional control measures in light of the four factors. Although it may conversely be the case that no such sources or control measures exist in a particular state with respect to a particular Class I area and implementation period, this should be determined based on a four-factor analysis for a reasonable set of in-state sources that are contributing the most to the visibility impairment that is still occurring at the Class I area. It would bypass the four statutory factors and undermine the fundamental structure and purpose of the reasonable progress analysis to treat the URP as a safe harbor, or as a rigid requirement.
As previously mentioned, and again here, the Regional Haze Rule makes it clear that states should not eliminate sources that could have cost-effective controls from consideration because a reasonable progress goal is below the URP. EPA’s recent Clarification Memo reinforces this point:33Memorandum from Peter Tsirigotis, Dir., EPA, to Reg’l Air Dirs., Regions 1–10 (July 8, 2021), hereafter referred to as the “Clarification Memo,” available here: https://www.epa.gov/visibility/clarifications-regarding-regionalhaze-state-implementation-plans-second-implementation. Page 15.
The 2017 RHR preamble and the August 2019 Guidance clearly state that it is not appropriate to use the URP in this way, i.e., as a “safe harbor.” The URP is a planning metric used to gauge the amount of progress made thus far and the amount left to make. It is not based on consideration of the four statutory factors and, therefore, cannot answer the question of whether the amount of progress made in any particular implementation period is “reasonable progress.” This concept was explained in the RHR preamble. Therefore, states must select a reasonable number [of] sources and evaluate and determine emission reduction measures that are necessary to make reasonable progress by considering the four statutory factors.
Because ODEQ used the URP as a safe harbor, it must revisit its source selection methodology, reconsider its thresholds, reasonably select a set of sources for four-factor analyses, and justify that decision making through adequate documentation.
7 ODEQ’s Control Determinations Are Arbitrary
ODEQ does not present a coherent basis for rejecting controls. The only explanations ODEQ provides when it rejects controls can be found in Section6 in the short paragraph summaries it presents on each four-factor analysis, which include statements such as: “DEQ concurs this is a reasonable conclusion,” or “the controls would not be cost-effective.” This in fact is a violation of section 51.308(f)(2)(i)of the RegionalHaze Rule:
The State must evaluate and determine the emission reduction measures that are necessary to make reasonable progress by considering the costs of compliance, the time necessary for compliance, the energy and non-air quality environmental impacts of compliance, and the remaining useful life of any potentially affects the anthropogenic source of visibility impairment. The State should consider evaluating major and minor stationary sources or groups of sources, mobile sources, and area sources. The State must include in its implementation plan a description of the criteria it used to determine which sources or groups of sources it evaluated and how the four factors were taken into consideration in selecting the measures for inclusion in its long-term strategy. In considering the time necessary for compliance, if the State concludes that a control measure cannot reasonably be installed and become operational until after the end of the implementation period, the State may not consider this fact in determining whether the measure is necessary to make reasonable progress.
As the rule requires, ODEQ must include in its implementation plan“a description of … how the four factors were taken into consideration in selecting the measures for inclusion in its long-term strategy.” Although ODEQ cites to the four-factors of section 51.308(f)(2)(i) in its SIP, during the entirety of its review, it presents no information as to how it has considered them.
Apparently realizing this error, ODEQ attempts to rectify it for “costs of compliance” beginning on page 45, near the end of its SIP and well after it has finished rejecting controls. Here, ODEQ performs a contorted attempt to cite to a NOx cost-effectiveness threshold without actually adopting it. It cites to the 2016 CSAPR rule in which EPA adopted a position that it was acceptable to develop EGU NOx ozone season emission budgets using a control stringency of $1,400 per ton. ODEQ then states that “DEQ is not selecting a $1,400 per ton NOx cost-of-control threshold; rather, DEQ believes that a NOx cost of-control level in the range of $1,400 to $2,000 is consistent with the goals of the Regional Haze program.” But then one paragraph later, ODEQ states, “DEQ concludes that a NOx cost-of-control threshold in the $1,400 to $2,000 per ton range is appropriate and reasonable.”
In the next paragraph, ODEQ notes that $5,000/ton has been widely used as a reasonable threshold in evaluating regional haze SO2 controls. It then opines that “[t]here is no reason to assume that this cost threshold must increase at every subsequent Regional Haze planning period.” ODEQ does not actually state that it is adopting a $5,000/ton threshold for SO2, and concludes by stating, “Given these technical and cost considerations, DEQ affirms that the submitted analyses reached the reasonable conclusions, and this implementation plan revision does not impose a requirement to install further SO2 controls on the 12 sources subject to the four-factor analysis requirement or on any other sources during this planning period.”
The only rationale for “selecting” such a low NOx threshold that emerges from the record is to limit the sources it examines. ODEQ does not explain why, considering the fact that $5,000/ton has been widely used as a reasonable threshold in evaluating regional haze SO2 controls, it could not have adopted it for NOx as well. This is completely arbitrary. ODEQ must revisit its entire source selection strategy and elucidate a rational basis for establishing source selection thresholds.
8 ODEQ Must Include Refined Coal in Its Four-Factor Analyses
According to EIA data, a number of the EGUs in Oklahoma have burned in the past or presently burn what is referred to as “refined” coal onsite, presumably in order to take advantage of federal income tax credits. These include AES Shady Point, GREC and River Valley.34See https://www.eia.gov/electricity/data/eia923/. In order to qualify for this tax credit, the Internal Revenue Service (IRS) requires that these EGUs must demonstrate “a reduction of at least 20 percent of the emissions of nitrogen oxide (NOx) and at least 40 percent of the emissions of either sulfur dioxide (SO2) or mercury (Hg) released when burning the refined coal.”35See https://www.irs.gov/irb/2010-40_IRB#NOT-2010-54.
It is unknown which facilities actually claim this tax break. Regardless, for every EGU that burns refined coal, claims the tax break, and has or will undergo a four-factor analysis, DEQ must require that the EGU demonstrate any NOx reduction it has achieved from refined coal. Because refined coal is minimally required to result in a 20% NOx reduction, it must be evaluated like any other NOx control. Furthermore, if the EGU is also claiming a 40% SO2 reduction, it must demonstrate that as well.
9 Review of the Oxbow Kremlin Calcined Coke Plant Four-Factor Analysis
The Oxbow Calcining Kremlin Calcining Plant is located in Garfield County. Its Title V Permit states that it receives raw petroleum coke by truck and rail from various refinery sources. It processes this raw coke through kilns, with natural gas and propane as a supplemental fuel, in order to calcine the coke. The calcined coke is loaded into bags, trucks or railcars for final shipment to customers. The facility operates three rotary kilns. Due to the age of the facility, it has been exempted from most rules and regulations.36Part 70 Permit, Air Quality Division State of Oklahoma Department of Environmental Quality, Permit Number: 2019-0973-TVR3 Oxbow Calcining LLC, revised 10/20/2006. Pdf page 2 of the July 1, 2021 staff evaluation. Two reports present in Appendix E are reviewed, consisting of a September 2020 Trinity Report, which references a September 2020 Sargent & Lundy (S&L) report.37Regional Haze Reasonable Progress Analysis, Oxbow Calcining LLC Kremlin Calcined Coke Plant, prepared by Trinity Consultants, September 29, 2020, hereafter referred to in this section as “the Trinity Report.” SO2 Control Technologies Evaluation to Support Regional Haze Rule Analysis, Revision 0, September 29, 2020, Sargent & Lundy. Hereafter referred to in this section as “the S&L Report.”
9.1. ODEQ Must Require Documentation for the Kremlin Cost-Effectiveness Calculations
As noted throughout this section, Kremlin’s contractors, Trinity and S&L, make a number of unsubstantiated claims regarding the types of, and limitations of, the SO2 control systems evaluated. Considering the evidence presented herein that many of these claims are in fact unjustified, ODEQ must demand proper documentation from Kremlin. As indicated above, this is a requirement of 40 CFR 51.308(f)(2)(iii). In addition, Kremlin’s contractor S&L, which produced the control cost analyses, must be required to provide documentation for its figures; instead they have no documentation whatsoever. Lastly, ODEQ must state in the SIP that it has specifically reviewed the confidential information that has been redacted in S&L’s report and has found it credible and its use acceptable.
9.2. The Kremlin Plant Must include NOx in Its Four-Factor Analysis
In Appendix E, ODEQ instructs Oxbow Calcining that the Kremlin Plant’s four-factor analysis for its three kilns is limited to SO2.38Letter to Whitney Hall from Kendal Stegman, dated July 1, 2020. Pdf page 175 of Appendix E. As the following table indicates, the Kremlin Plant’s NOx emissions are significant:39Emission data obtained from https://www.deq.ok.gov/air-quality-division/emissions-inventory/state-emissions-totals-infographics/.
Table 1. Historical NOx and SO2 Emissions from the Kremlin Calcined Coke Plant
| Year | SO2 (tons) | NOx (tons) |
| 2016 | 12663.0 | 610.4 |
| 2017 | 16681.8 | 786.6 |
| 2018 | 17644.7 | 771.2 |
| 2019 | 12716.9 | 603.9 |
| 2020 | 13656.9 | 592.0 |
The South Coast Air Control District has identified a number of potential post-combustion controls that are feasible for coke calcining kilns, including SCR, LoTOx, and UltraCat.40See Preliminary Draft Staff Report, Proposed Rule 1109.1 – Emissions of Oxides of Nitrogen from Petroleum Refineries and Related Operations and Proposed Rescinded Rule 1109 – Emissions of Oxides of Nitrogen from Boilers and Process Heaters in Petroleum Refineries, August 2021. See discussion beginning on pdf page 183. Available here: http://www.aqmd.gov/docs/default-source/rule-book/Proposed-Rules/1109.1/pdsr_pr-1109-1_75_day.pdf?sfvrsn=6. These controls are capable of 95% NOx removal. ODEQ must therefore require that NOx controls be evaluated as part of the Kremlin Calcining Plant four-factor analysis.
9.3. The Kremlin SO2 Scrubber Design SO2 Values Are Too High
On page 2-3 of its report, Trinity states that it adopted the S&L SO2 emission figures for the three kilns when performing its cost-effectiveness calculations. These figures are compiled by S&L, along with maximum SO2 values and are reproduced below:41See page 6 of the S&L Report.
Table 2. S&L Kremlin Kiln SO2 Emissions
| Emission | Kiln 1 | Kiln 2 | Kiln 3 | Relevant Totals |
| Hourly SO2 (lb/hr) | 1626 | 1447 | 924 | |
| Annual Average SO2 (tons) | 6556 | 5674 | 2950 | 15180 |
| Maximum Monthly SO2 (tons) | 761 | 755 | 381 | |
| Maximum Annual SO2 (tons) | 9132 | 9060 | 4572 | 22764 |
According to S&L, the hourly emission rates represent the average lb/hr rates for the period of January 2015 to December 2019. The annual emission rates represent the 12-month annual average tons/yr for the period of January 2018 to December 2019. The maximum monthly emissions rates shown represent the monthly total tons/month for the baseline period of January 2018 to December 2019.
S&L states that it used the maximum values to design the SO2 control equipment, reasoning that such controls would have to be designed to treat exhaust gas based on these historical conditions. However, S&L further notes that the facility’s existing Operating Permit Air Permit No. 2014-1698TVR2 (M-2), dated August 9, 2017, includes a combined maximum SO2 emission limit of 4,790.90 lb/hr for the facility. Therefore, the maximum monthly emission rates reflect the maximum that each unit has reached separately, but not operating all at once.
This is an important consideration: even if the facility operated 24 hours a day continuously all year (24/7/365), its permit would restrict it to a maximum annual SO2 emission of 20,984 tons (4,790.9 tons x 8,760 hrs/yr x ton/2,000 lbs). However, S&L’s SO2 control equipment is based on a maximum of 22,764 tons. S&L therefore over designed its control equipment.
9.4. The Kremlin Wet Scrubber Cost-Effectiveness Calculation Is Greatly Inflated
As discussed below, the Kremlin cost-effectiveness calculations contain a number of assumptions that serve to greatly inflate Trinity’s cost-effectiveness calculations. These include (1) not considering combining the exhaust from all three kilns into one flue gas cooler and one absorber, (2) actually concluding that a separate waste heat electricity generation unit is required in order to lower the scrubber inlet temperature, (3) assuming a scrubber efficiency that is too low (4) assuming a contingency that is too high, (5) assuming too many additional operational personnel are needed, and (6) assuming an equipment life that is too low. None of these flaws were corrected by ODEQ.
9.4.1. Kremlin’s Scrubber Efficiency Figures Are Low
S&L provides no justification for its assumption that Kremlin’s wet scrubber should be assumed to have an efficiency of 94%, its dry scrubber 92%, and DSI 40%. On page 2-3 of its report, Trinity attempts to link these figures back to EPA’s BART FIP, and to cite to EPA’s action regarding the Nelson Unit 6 in Louisiana. However, Trinity’s linkage fails for several reasons. In its BART FIP, EPA actually assumed wet scrubber efficiencies of 98% with a floor of 0.04 lbs/MMBtu. Similarly, EPA assumed dry (SDA) scrubber efficiencies of 95% with a floor of 0.06 lbs/MMBtu. In other words, if operation of the SDA at 94% would cause the SO2 outlet to fall below 0.06 lbs/MMBtu, then whatever efficiency corresponded to 0.06 lbs/MMBtu was used. This is clearly explained in EPA’s proposal.42See 82 FR 925. Note these values were in fact first established in the Oklahoma FIP. A similar approach was adopted for the Entergy Nelson evaluation.43See 82 FR 32298: “Entergy assessed SDA and wet FGD as being capable of achieving SO2 emission rates of 0.06 lb/MMBtu and 0.04 lb/ MMBtu, respectively. As we discuss in the TSD, based on review of IPM documentation, industry publications, and real-world monitoring data, we agree with the LDEQ that 98% control efficiency for wet FGD and 95% control efficiency for SDA are reasonable assumptions and consistent with the emission rates identified by Entergy.” It should be further noted that had Trinity followed all of the procedures outlined in these two actions, from which it attempts to cherry-pick data, much of the adjustments outlined below to Kremlin’s cost-effectiveness calculations would not have been necessary.
9.4.2. Kremlin Does Not Adequately Consider Cooling Options
Beginning on page 7 of its report, S&L discusses the options to lower the flue gas temperature exiting the kilns prior to entering the SO2 control devices it considers. S&L states that the flue gas temperature is approximately 1,700 – 1,850°F, and that it must be lowered to 400°F to accommodate any of the SO2 controls it considers, which consists of wet scrubbing, dry scrubbing and Dry Sorbent Injection (DSI). S&L does not provide any documentation for this temperature data and ODEQ must require Kremlin to provide that data under 40 CFR 51.308(f)(2)(iii). This documentation should (1) confirm the temperature of the flue gas at the point at which it would enter the various SO2 controls contemplated, and (2) confirm the upper limit of the SO2 control device inlet temperature.
S&L considers three methods to reduce the temperature of the flue gas: (1) water-based quenching, (2) air-based quenching, and (3) a waste heat recovery system used to drive a steam turbine generator (one for each kiln) which produces electricity for sale to the grid.
Kremlin Must Consider Closed Loop Cooling
S&L dismisses water-based quenching because it claims that it would increase Kremlin’s water usage by approximately 180% which would require an additional 1,200 gpm for the cooling alone. On page 7, S&L opines that this rate of water cannot be guaranteed “due to the unconfirmed availability and/or Enid Kaw Lake Pipeline water take-off restrictions, as well as the significant amount of water lost to atmosphere.” S&L then concludes that water-based quenching is not considered to be a reliable or practical flue gas temperature control option and was not evaluated further. ODEQ must require that Kremlin provide documentation to support this water usage claim. S&L provides little detail concerning the water-based cooling system it envisions, only stating the following on page 7 of its report:
This temperature reduction option requires the injection of water into new ductwork designed for the new flue gas conditions and to allow for adequate water/flue gas contact. Water-based quenching systems would require significant quantities of freshwater, which would be lost to the atmosphere through evaporation.
It appears that S&L only evaluates a wet, open loop, “once through” water-based cooling system, in which large quantities of water are allowed to evaporate and must therefore be replaced. This is perplexing, as S&L is undoubtedly aware, the power generation industry has been using water conservation cooling towers and closed loop dry cooling systems for decades. Regarding water conservation cooling towers, the oft cited reference, “Cooling Tower Fundamentals” states:44Hensley, John C., ed. 2006. Cooling Tower Fundamentals. SPX Cooling Technologies, Inc. 2006. Page 65. Available here: https://spxcooling.com/wp-content/uploads/Cooling-Tower-Fundamentals.pdf
The evaporative cooling tower was originally conceived as a water conservation device, and it continues to perform that function with an ever-increasing efficiency, sacrificing only from 3% to 5% of the circulating water to evaporation, drift and blowdown. This conservation rate in excess of 95% is a boon to industrial areas which are confronted with a limited or costly water supply.
Also, beyond this, dry cooling uses water contained in a closed loop, resulting in no loss to evaporation. Dry cooling is common in arid location where water conservation is a necessity.45See for instance, https://spgdrycooling.com/news/dry-cooling/, or https://www.babcock.com/home/environmental/spig-cooling-systems/dry-cooling-systems, or https://www.evapco.com/dry-cooling-101
Thus, considerable water savings could be realized by the use of a typical water conservation type cooling tower system or a dry cooling system. ODEQ must therefore require that Kremlin consider both a (1) water conservation type cooling tower system and (2) a dry cooling system.
Kremlin Wrongly Dismisses Air Cooling
On page 8, S&L dismisses air-based cooling. Without any documentation, S&L opines that air-based cooling may result in dew-point corrosion in the heat exchanger, causing more frequent outages. It concludes that due to the relatively larger footprint in an already severely space constrained location as compared to water-based quenching, corrosion risks and potentially increased maintenance costs, air-based quenching is not considered a technically feasible or practical flue gas cooling technology for the facility and therefore was not evaluated further.
First, because S&L specifies that the flue gas temperature must be cooled to 400°F, corrosion is unlikely to be an issue. The composition of the exhaust is similar to that of a coal-fired boiler, and the concern is to prevent the condensation of sulfuric acid. As the Electric Power Research Institute (EPRI) reports in its Wet Stacks Design Guide, “Depending on the sulfur content of the coal and the moisture content of the flue gas, the sulfuric acid dewpoint of the unscrubbed bypass gas is 260 to 300 degrees F (127-149°C).”46Wet Stacks Design Guide, TR-107099 9017, Final Report, November 1996, prepared by BURNS & McDonnell for Electric Power Research Institute. Page 1-6. Available here: https://www.epri.com/research/products/TR-107099. Thus, the exhaust temperature will be above the point at which sulfuric acid condensation should occur. S&L’s completely undocumented concerns aside, even if corrosion were a problem, this is a maintenance item and is therefore not a technical feasibility issue.
Second, S&L presents no documentation concerning the size of the air-cooling system that would be needed, or that such a size prevents its implementation. As ODEQ’s own permit evaluation indicates, “The facility occupies an area of 320 acres, of which approximately 80 acres have been developed for the calcining operation.47ODEQ, Air Quality Division Memorandum, July 1, 2021, Evaluation of Permit Application No. 2019-0973-TVR3 Oxbow Calcining LLC Kremlin Calcining Plant (FAC ID 801). Page 1. Thus, information in the record indicates the facility has a great deal of available space. As even a causal examination of the aerial photographs of EGUs and industrial facilities indicates, cooling systems are often located some distance away from the fuel burning unit. Thus, any amount of additional available space offers flexibility. S&L itself notes on page 3 of its report that “[t]he Kremlin facility has open space available on-site, north of the existing kilns, which can be used for any additional equipment.” S&L’s space constraint concerns therefore appear to be specious. ODEQ must require that Kremlin consider an air-cooled system.
Kremlin Wrongly Claims an Electrical Power Generation Plant Is a Necessary Part of Scrubbing
After erroneously dismissing water and air cooling, S&L comes to the conclusion that the only suitable cooling system for the Kremlin plant is one that captures the waste heat, and uses it to produce steam that then drives a steam turbine generator to produce electricity. If this were not incredible enough, S&L then states on page 12 of its report, “Since the primary purpose of the heat recovery system is to provide flue gas cooling, it should be noted that auxiliary power consumption costs for the APC and supporting systems are still included in this evaluation, no credit for base plant auxiliary power consumption savings or excess power generation sale to the grid were accounted for in this evaluation.” In other words, S&L claims that a separate power generation plant is a necessary requirement for the installation of a scrubber at the Kremlin plant, but concludes that it would be improper to offset this cost by considering the value of the produced electricity. Further inflating the cost, S&L claims that separate steam turbine generators are necessary for each of the kilns. As indicated above, both water-based dry cooling and air-cooling are widely used and technically feasible. Instead of employing one of these technologies, S&L artificially inflates Kremlin’s SO2 control cost-effectiveness calculations by only considering that waste heat steam turbine generators are necessary. ODEQ must correct this situation.
9.4.3. Kremlin Must Consider One Flue Gas Cooler and Scrubber for All Three Kilns
The erroneous assumptions S&L makes with regard to the type of flue gas cooler aside, S&L considers it necessary to configure a separate flue gas cooler and induced draft fan for each kiln. S&L states on page 26 of its report that it assumed two wet flue gas systems: one to service Kilns 1 and 2 and another for Kiln 3, due to “site space constraints.” On page 31, S&L makes the same assumptions for its dry scrubbing cost analysis. In addition, approximately three times as many personnel are required to operate all of this equipment than if one set of systems serviced all three kilns, which further inflates the cost. No documentation, such as site drawings or pictures was presented to substantiate these claims.
Because combining the exhaust from all three kilns into a common duct with one induced draft fan, one cooling system, one scrubber system (likely one absorber for either dry or wet scrubbing), and a reduction in operating personnel, would result in significant cost savings, ODEQ must require that Kremlin investigate this configuration.
9.4.4. Kremlin’s 20 Year Operating Life Assumption Is Not Justified
On page 43 of its report, S&L makes the following statement regarding equipment life:
Considering the novel application of this equipment on the calcining process, it is unknown what effects the process flue gas will have on the typical equipment life and how costs would be applied to achieve longer equipment lifespans. When the process conditions are well established, an industry standard 20-year equipment life is assumed to be representative of the most economical equipment design (i.e., material of constructions, equipment components and other design aspects are engineered and/or selected for ensuring the supplied system will not require complete refurbishment outside of typical manufacturer directed maintenance program for the duration of a 20-year useful life). Equipment could be designed to achieve a longer useful life but would likely result in substantially increased capital and operating costs. Thus, the 20-year equipment life of the control measures was used in the four-factor analysis to calculate emission reductions, amortized costs, and cost-effectiveness.
There is nothing novel about the control equipment being considered or the environment in which the equipment will function. The mere fact that this equipment will be applied to a petroleum pet coke calcining plant instead of an EGU or an industrial boiler that burns petroleum coke is an insignificant determinant to equipment life. S&L’s statement that “When the process conditions are well established, an industry standard 20-year equipment life is assumed to be representative of the most economical equipment design” is completely unsupported and has no relationship to any guidance or recommendations in the Control Cost Manual.
Regarding this, the Control Cost Manual states: “The life of the control is defined in this Manual as the equipment life. This is the expected design or operational life of the control equipment. This is not an estimate of the economic life, for there are many parameters and plant-specific considerations that can yield widely differing estimates for a particular type of control equipment.”48See Control Cost Manual, Section 1, Chapter 2, Cost Estimation: Concepts and Methodology, November 2017, page 22. EPA has consistently assumed a thirty-year equipment life for scrubber retrofits, scrubber upgrades, SCRs, and SNCR installations. Much of this is summarized and cited in EPA’s response to comments document for its Texas and Oklahoma Regional Haze SIP final disapproval and FIP.49See Response to Comments for the Federal Register Notice for the Texas and Oklahoma Regional Haze State Implementation Plans; Interstate Visibility Transport State Implementation Plan to Address Pollution Affecting Visibility and Regional Haze; and Federal Implementation Plan for Regional Haze, Docket No. EPA-R06-OAR-2014-0754, 12/9/2015, available here: https://www.regulations.gov/document?D=EPA-R06-OAR-2014-0754-0087. See pages 240-245, 268, and 274. See also the Texas BART FIP proposal, which conducted extensive cost determinations for scrubber upgrades, at 82 FR 930 and 938. See also Control Cost Manual, Section 4, Chapter 2, Selective Catalytic Reduction, June 2019, pdf page 80: “For the purposes of this cost example, the equipment lifetime of an SCR system is assumed to be 30 years for power plants.”
A number of EGU contractors have been assuming an equipment life of twenty years for SNCR systems, by reference to the Control Cost Manual. The 4/25/2019 SNCR update of the Control Cost Manual does state on page 1-53, “Thus, an equipment lifetime of 20 years is assumed for the SNCR system in this analysis.”50Section 4, Chapter 1, Selective Noncatalytic Reduction, April 2019, page 1-53. However, this is a calculation example and does not indicate that EPA universally considers the equipment life for all SNCR systems installed on EGUs to be twenty years. Just prior to this statement, EPA notes, “As mentioned earlier in this chapter, SNCR control systems began to be installed in Japan the late 1980’s. Based on data EPA collected from electric utility manufacturers, at least 11 of approximately 190 SNCR systems on utility boilers in the United States were installed before January 1993. In responses to another Institute of Coal Research (ICR), petroleum refiners estimated SNCR life at between 15 and 25 years.” Therefore, based on a 1993 SNCR installation date, these SNCR systems are at least twenty-eight years old, which all other considerations aside, strongly argues for a thirty-year equipment life. Furthermore, an SNCR system is much less complicated than a SCR system, for which EPA clearly indicates the life should be thirty years. In an SNCR system, the only parts exposed to the exhaust stream are lances with replaceable nozzles. The injection lances must be regularly checked and serviced, but this can be done relatively quickly, if necessary, is relatively inexpensive, and should be considered a maintenance item. In this regard, the lances are analogous to SCR catalyst, which is not considered when estimating equipment life. All other items, which comprise the vast majority of the SNCR system capital costs, are outside the exhaust stream and should be considered to last the life of the facility or longer.
Thus, all types of scrubbers, DSI systems, SCR systems, SNCR systems, and NOx combustion controls should have equipment lives of thirty years unless the unit’s retirement is secured by an enforceable commitment. Unless there is a documentable reason to select a shorter life, thirty years should also be the default equipment life used for the cost analyses of these types of controls in any application. Use of a shorter equipment life artificially inflates the cost-effectiveness figures (higher $/ton).
ODEQ questioned Kremlin’s use of a 20-year operating life in its January 31, 2022, letter.51See Appendix E, pdf page 270. In response, Kremlin merely reiterated the language from page 43 of the S&L report, reproduced above. ODEQ must reject this as inadequate and require that absent real documentation (not provided in this case) or an enforceable commitment for a shorter life, a 30-year equipment must be used in all cost-effectiveness calculations.
9.4.5. ODEQ Must Verify Kremlin’s Interest Rate
Kremlin uses a 10% interest rate, documented by a signed affidavit by the Treasurer of Oxbow Carbon LLC, mush of which has been redacted.52See Appendix E, pdf page 279. ODEQ must state in its SIP whether it finds this documentation satisfactory. This is necessary in order to comply with the documentation requirements of 40 CFR 51.308(f)(2)(iii).
9.4.6. Miscellaneous Cost-Inflating Items That Must Be Removed From S&L’s Analyses
As indicated in Appendix A of its report, S&L included sales tax in all of its cost analyses. It appears that for Kremlin’s application, air pollution control equipment is exempt from sales tax in Oklahoma.53See https://oklahoma.gov/tax/search.html?term=pollution+control+. ODEQ must confirm whether this is true and if exempt, require that it be removed.
S&L includes owner’s costs and escalation during construction charges. However, as the Control Cost Manual indicates, “owner’s costs and AFUDC costs are capital cost items that are not included in the EPA Control Cost Manual methodology, and thus are not included in the total capital investment (TCI) estimates in this section.54Control Cost Manual, Section 4, Chapter 2, Selective Catalytic Reduction, June 2019, pdf page 65. Similarly, regarding escalation the Control Cost Manual also states:55Control Cost Manual, Section 1 Introduction, Chapter 2 Cost Estimation: Concepts and Methodology, November 2017, page 18.
This Manual uses real prices for estimation of capital costs (in this case, an older capital cost to a more recent year), and other costs for any given cost analysis, not nominal prices. Using a price of reagent, catalyst, or other cost input to reflect possible price changes over the equipment lifetime is not correct in adjusting for inflation. Hence, the inclusion of price inflation via escalation estimates or having input prices reflect price changes over time as part of capital cost estimation is not allowed under the Control Cost Manual Methodology.
Therefore, DEQ must require that these cost items be removed from all control cost analyses.
S&L includes a contingency of 20% of the direct and indirect costs, which is excessive. Kremlin has presented no information that would indicate that the installation of a cooling system and a scrubber, both of which are mature technologies and have been installed on hundreds of sources, present any unique challenges. As the Control Cost Manual states: “A default value of 10% of the direct and indirect costs is typically used for CF [contingency factor]. However, values of between 5% and 15% may be used.”56 Unless documentation is provided that justifies a higher value, ODEQ must require that the low end of this range be used.
9.4.7. Revised Kremlin Wet Scrubber Cost-Effectiveness Calculation for Kiln 1
As discussed above, S&L has taken a number of opportunities to wrongly inflate the cost-effectiveness of SO2 control equipment at the Kremlin facility. Neither S&L nor Trinity have presented any significant documentation to support the key cost items. In addition, S&L only provides an all-in-one capital cost, which includes the cost of the scrubber and that of the steam turbine generator. S&L further fails to provide costs for two other technically feasible cooling options to lower kiln flue gas temperature to that suitable for use with SO2 control equipment: a dry cooler and an air cooler. Therefore, an accurate revision to S&L’s inflated SO2 controls cannot be performed.
Two approaches were taken to address this issue. Option 1 makes the adjustments described in the subsections above, and deletes obvious charges related to the installation of the steam turbine generator. This option inherently overpredicts the cost-effectiveness because it still retains S&L’s costs for the steam turbine generator and S&L’s failure to consider a single wet scrubber and cooling system that would serve all three kilns through common flue gas ducting.
Option 2 retains these corrections, plus it applies a 20% reduction in the purchased equipment and direct installation costs to estimate the savings from the substitution of dry cooling for the steam turbine generator. Because of S&L’s failure to separate out the capital cost items, no documentation can be provided to support this 20% reduction. Nevertheless, it is offered as a conservative indication of the additional cost inflation inherent in S&L’s costs due to inclusion of the steam turbine generator. The revised cost-effectiveness for both options are presented below:56Control Cost Manual, Section 5, SO2 and Acid Gas Controls, Chapter 1 Wet and Dry Scrubbers for Acid Gas Control, April 2021. Page 1-79.
Table 3. Revised Cost-Effectiveness of Wet Scrubber for Kremlin Kiln 1
| DIRECT COSTS | UNIT 1 | OPTION 1 | OPTION 2 | COMMENTS |
| Purchased Equipment Costs (PEC) | $49,178,000 | $49,178,000 | Includes scrubber + steam turbine generator | |
| Sales Tax | $2,459,000 | $0 | $) | Assumed sales tax not applicable. |
| Freight | $2,459,000 | $2,459,000 | ||
| Total PEC | $54,096,000 | $51,637,000 | $41,309,600 | Option 2 conservatively reduces Option 1 figure by 20% to delete steam turbine and assume dry cooling |
| Direct Installation Costs | ||||
| Total Direct Installation Costs (TDIC) | $27,781,000 | $27,781,000 | $22,224,800 | Conservatively reduced by 20% in Option 2 to delete steam turbine and assume dry cooling |
| Total Direct Costs (TDC=PEC+TDIC) | $81,877,000 | $79,418,000 | $63,534,400 | |
| Indirect Costs (31% of TDC) | $25,382,000 | $24,619,580 | $19,695,664 |
| Owners Cost | -$1,588,360 | -$1,270,688 | Delete disallowed owners’ costs | |
| Total Indirect Costs (TIC) | $25,382,000 | $23,031,220 | $18,424,976 | |
| Contingency Percentage (% of TDC+TIC) | 20 | 10 | 10 | Reduce contingency to 10% |
| Contingency | $21,451,800 | $10,244,922 | $8,195,938 | |
| Total Capital Investment (TCI) | $128,710,800 | $112,694,142 | $90,155,314 | |
| Escalated TCI (2024) | $144,865,000 | $112,694,142 | $90,155,314 | Escalation not allowed |
| Equipment Life (years) | 20 | 30 | 30 |
| Interest Rate (%) | 10 | 10 | 10 | |
| Capital Recovery Factor (CRF) | 0.1175 | 0.1061 | 0.1061 | |
| Annualized Capital Costs (CRF x TCI) | $15,118,000 | $11,954,510 | $9,563,608 | |
| Escalated Annualized Capital Costs | $17,016,600 | $11,954,510 | $9,563,608 | Escalation (and double escalation not allowed) |
| Operating Costs | ||||
| Increased Waste Disposal Costs | $991,000 | $991,000 | $991,000 | |
| Limestone Reagent Costs | $800,000 | $800,000 | $800,000 | |
| Increased Auxiliary Power Cost | $519,000 | $519,000 | $519,000 |
| Increased Water Cost | $1,690,000 | $393,000 | $393,000 | Assume dry cooling (no water loss), so reduced to 23.3% (280 gpm/1,200 gpm)57See page 7 of the S&L report: “water requirements at the facility would increase approximately 180% of the current facility consumption rate of 670 gpm, requiring approximately 1,200 gpm for the cooling alone. Water will also be required to operate some of the SO2 control systems, requiring an additional approximately 150 to 280 gpm depending on the technology.” |
| Demineralized Water Cost | $678,000 | $0 | $0 | Assumed to be used in the steam turbine, so deleted for dry cooling |
| Total Variable O&M Costs | $4,678,000 | $2,703,770 | $2,703770 | |
| Fixed O&M Costs | ||||
| Labor (operator and supervisor) | $7,723,000 | $2,246,400 | $2,246,000 | CCM annual labor cost for scrubber = 12 x 2080 hrs/yr x $60/hr. Assumed additional ½ for dry cooling system |
| Maintenance Materials | $1,228,000 | $1,228,000 | $1,228,000 | |
| Water Supply Pipeline Right-of-Way | $70,000 | $0 | $0 | Not needed for dry cooling |
| Water Treatment System Rental | $2,160,000 | $0 | $0 | Not needed for dry cooling |
| Total Fixed O&M Costs | $11,181,000 | $3,474,400 | $3,474,400 |
| Indirect Operating Costs (4% of TCI) | $5,148,000 | $4,507,766 | $3,606,213 | |
| Total Annualized Costs | $21,007,000 | $10,685,936 | $9,784,383 | |
| Escalated Total Annualized Costs (2004) | $23,644,000 | $10,685,936 | $9,784,383 | Escalation not allowed |
| Total Annualized Costs | $36,125,000 | $22,640,446 | $19,347,990 | |
| Escalated Total Annualized Costs | $40,660,000 | $22,640,446 | $19,347,990 | Escalation not allowed |
| Control Efficiency (%) | 94 | 98 | 98 | Based on emission reduction, efficiency is 94.3. Used 98% in revised |
| Baseline SO2 Emissions (tons) | 6,556 | 6,556 | 6,556 |
| Emissions Reduction (tons) | 6,185 | 6,425 | 6,425 | |
| Cost-Effectiveness ($/ton) | $6,574 | $3,524 | $3,011 |
As can be seen from the above table, after correcting for the issues described above in Option 1, a cost-effectiveness of $3,524/ton results. Further making conservative and reasonable estimated corrections in Option 2 to the purchased equipment and direct installation costs to delete the steam turbine generator, further reduces the cost-effectiveness to $3,011/ton. Still, this figure is likely high, because of S&L’s failure to consider a single wet scrubber and cooling system that would serve all three kilns through common flue gas ducting.
S&L and Trinity also perform a cost-effectiveness calculation for a wet scrubber assuming a water supply pipeline is not an option, and all the additional water must be trucked into the facility. However, as discussed earlier, use of a dry cooling system would not require any significant additional water, so evaluation of this option is moot.
Due to time constraints, similar calculations were not made for the wet scrubbers Kilns 2 and 3, and for Trinity and S&L’s dry scrubber and DSI evaluations. However, the cost-effectiveness figures for these options would be improved by similar margins.
10 Review of the Western Farmers Electric Cooperative Hugo Four-Factor Analysis
The Western Farmers Electric Cooperative (WFEC) owns and operates the Hugo Electric Generating Plant, located in Choctaw County, Oklahoma. It consists of one 477 MW dry bottom wall-fired unit that burns subbituminous coal. This unit is fitted with NOx combustion controls and no SO2 controls. The four-factor report, which is present in Appendix E, is reviewed below.58Regional Haze Rule Four-Factor Reasonable Progress Analysis, prepared by Trinity Consultants, August 20, 2020, hereafter referred to in this section as “the Trinity Report.”
The SO2 and NOx emissions for Hugo Unit 1 are presented below:59See the file entitled, “OK EGU emissions.xlsx.”
Figure 1. Hugo Unit 1 Historical Emissions
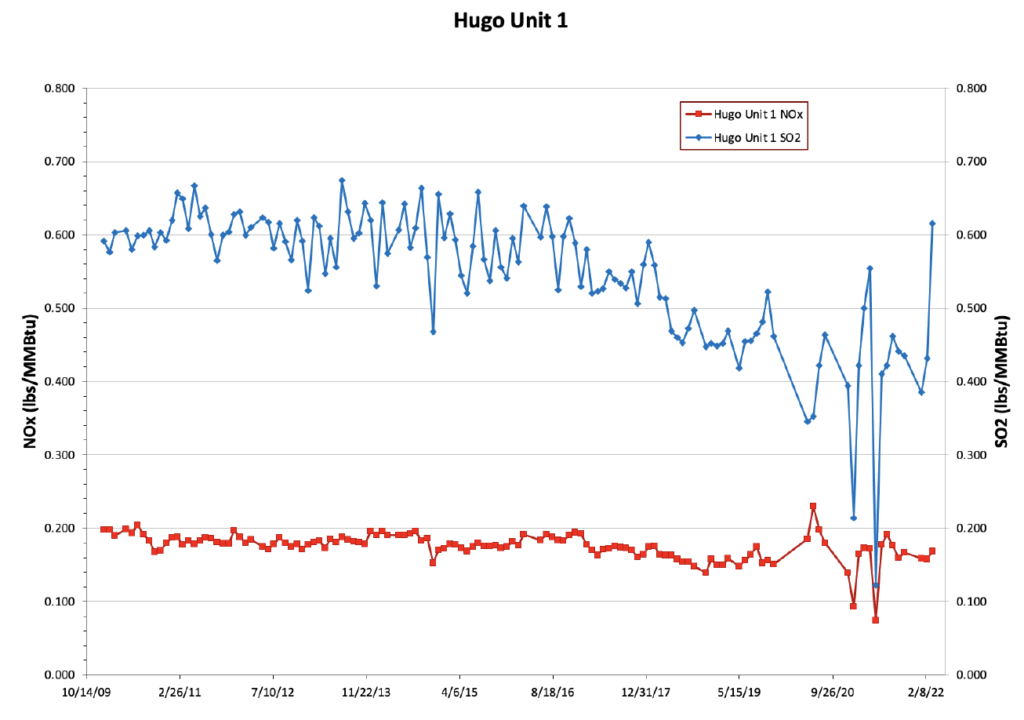
The gradual decrease in the SO2 rate, seen to occur beginning in 2017 appears to reflect usage of a lower sulfur coal. The fluctuations present in the SO2 rate likely also reflect differences in the sulfur content of the coal, since the unit has no SO2 controls.
10.1. Hugo’s Scrubber and DSI Cost-Effectiveness Methodologies Are Invalid
As ODEQ points out in its letter to Western Farmers, its methodology of escalating 2009 $/kW figures picked from other scrubber and DSI cost analyses is not valid, due to the length of escalation time.60See Appendix E, pdf page 377. ODEQ rightly points out that the Control Cost Manual clearly states this approach is invalid:61Control Cost Manual, Section 1 Introduction, Chapter 2 Cost Estimation: Concepts and Methodology, November 2017. Page 19 (citing Vatavuk, W., Updating the CE Plant Cost Index, Chem. Eng., pp. 62-70, January 2002).
It should be noted that the accuracy associated with escalation (and its reverse, deescalation) declines the longer the time period over which this is done. Escalation with a time horizon of more than five years is typically not considered appropriate as such escalation does not yield a reasonably accurate estimate. Thus, obtaining new price quotes for cost items is advisable beyond five years. If longer escalation periods are unavoidable due to limited recent cost data that is reasonably available, then the analysis should use the principles in this Manual chapter to provide as accurate an escalation as possible consistent with the Manual given the limitations of the cost analysis. The appropriate length of time for escalation can vary as a result of significant changes in the cost of major production inputs (e.g., energy, steel, chemical reagents, etc.) and technological changes in control measures, particularly if these changes occur in an unusually short period of time. Hence, shorter time periods for escalation and de-escalation are clearly preferred over longer ones.
In this case, escalation beyond five years is not “unavoidable” since the Control Cost Manual itself provides cost models for wet and dry scrubbers.62See the spreadsheet in Section 5: https://www.epa.gov/economic-and-cost-analysis-air-pollution-regulations/cost-reports-and-guidance-air-pollution. Alternatively, note that EPA’s IPM cost models, on which these cost models are based, include wet and dry scrubbing and DSI costs, have been available since the first planning period and were used extensively. Western Farmers’ response that the Control Cost Manual’s “rule of thumb” is not substantiated or that it is “out-of-context” is obviously incorrect.63See Appendix E, pdf page 380. Thus, ODEQ must follow through and require that Hugo properly perform its cost-estimates.
10.2. Hugo’s Scrubber Cost-Effectiveness Calculation Is Inflated
Using the cost models referenced above, the cost-effectiveness was calculated for wet and dry scrubbers for the Hugo EGU. In so doing, the same emission dataset used by Trinity in its report— monthly emissions from 2018 through 2019—was also used. However, a number of corrections were made. These include the SO2 inlet, which Hugo calculates as 0.462 lbs/MMBtu, which based on the data is actually 0.479 lbs/MMBtu.
Trinity refers to its calculation of the fractional time the unit operates as a “capacity factor.” This is incorrect, as the capacity factor is defined as the ratio of the electrical energy produced by a generating unit for the period of time considered to the electrical energy that could have been produced at continuous full power operation during the same period.64See https://www.eia.gov/tools/glossary/index.php?id=Capacity_factor. Calculations based simply on the time the unit was operating overlook the usual situation in which the power plant can be listed as running for the full time period (e.g., 24 hours/day, 30 day/month, 365 days/yr) but was not running at full load. Therefore, Trinity’s use of a 0.45 capacity factor is wrong and its reference to EPA’s FIP’s use of this methodology is incorrect.
Also, Trinity calculates an SO2 baseline of 3,211 tons, based on multiplying its average SO2 emission rate of 0.462 lbs/MMBtu by its average annual heat input of 13,901,244 MMBtu/yr. Using the corrected SO2 inlet of 0.479 results in a value of 3,327 tons, which compares more closely to an average of the 2018-2019 SO2 emissions of 3,379 tons, and is the method EPA’s cost model calculates SO2 emissions in the analyses that follow.
Lastly, the interest rate used was 4%, which is the current Bank Prime rate. A summary of the cost-effectiveness calculations is presented below:65See the file entitled, “Hugo wetanddryscrubbers_controlcostmanualspreadsheet_may_2021.xlsm.”
Table 4. Hugo Unit 1 Dry Scrubber Cost-Effectiveness
SDA Selected Input and Outputs
| Fuel Type | Coal | |
| Retrofit factor | 1 | |
| MW rating | 446 | MW |
| SO2 inlet (lbs/MMBtu) | 0.479 | Btu/lb |
| Annual MWh output | 1,196,982 | MWh |
| Total System Capacity Factor (CF_total) | 0.036 | |
| Net plant heat input rate (NPHR) | 11.6 | MMBtu/MW |
| SO2 outlet | 0.06 | lb/MMBtu |
| Scrubber efficiency | 87.47 | 5 |
| Plant elevation | 480 | feet |
| Desired dollar-year | 2020 | |
| Interest rate | 4.0 | Percent |
| Equipment life | 30 | years |
| Total Capital Investment (TCI) | $222,908,249 | |
| Direct Annual Costs (DAC) | $6,183,184 | |
| Indirect Annual Costs (IDAC) | $12,954,172 | |
| Total Annual Costs (TAC)=DAC+IDAC | $19,137,356 | |
| SO2 removed | 2,908.9 | tons/yr |
| Cost-effectiveness | $6,579 | $/ton |
Table 5. Hugo Unit 1 Wet Scrubber Cost-Effectiveness
Wet FGD Selected Input and Outputs
| Fuel type | Coal | |
| Retrofit factor | 1 | |
| MW Rating | 446 | MW |
| SO2 inlet (lbs/MMBtu) | 0.479 | Btu/lb |
| Annual MWh Output | 1,196,982 | MWh |
| Total System Capacity Factor (CFtotal) | 0.306 | |
| Net plant heat input rate (NPHR) | 11.6 | MMBtu/MW |
| SO2 outlet | 0.04 | lb/MMBtu |
| Scrubber efficiency | 91.65 | % |
| Plant elevation | 480 | feet |
| Desired dollar-year | 2020 | |
| Interest rate | 4.00 | Percent |
| Equipment life | 30 | years |
| Total Capital Investment (TCI) | $245,391,313 | |
| Direct Annual Costs (DAC) | $6,875,794 | |
| Indirect Annual Costs IIDAC) | $14,272,716 | |
| Total Annual Costs (TAC)=DAC+IDAC | $21,148,511 | |
| SO2 removed | 3,047.8 | tons/yr |
| Cost-effectivness | $6,939 | $/ton |
As can be seen from the above, dry and wet scrubber cost-effectiveness figures of $6,579/ton and $6,939/ton are much lower than the figures of $8,203/ton and $8,462/ton that Trinity calculates.
It should be further noted that the Hugo scrubber cost-effectiveness calculations are highly sensitive to the year of the data used, which reflects the recent declining capacity of the unit. As indicated by the following table, Hugo’s capacity has declined in recent years but it experienced a slight rebound in 2021.
Table 6. Hugo’s Historical Capacity
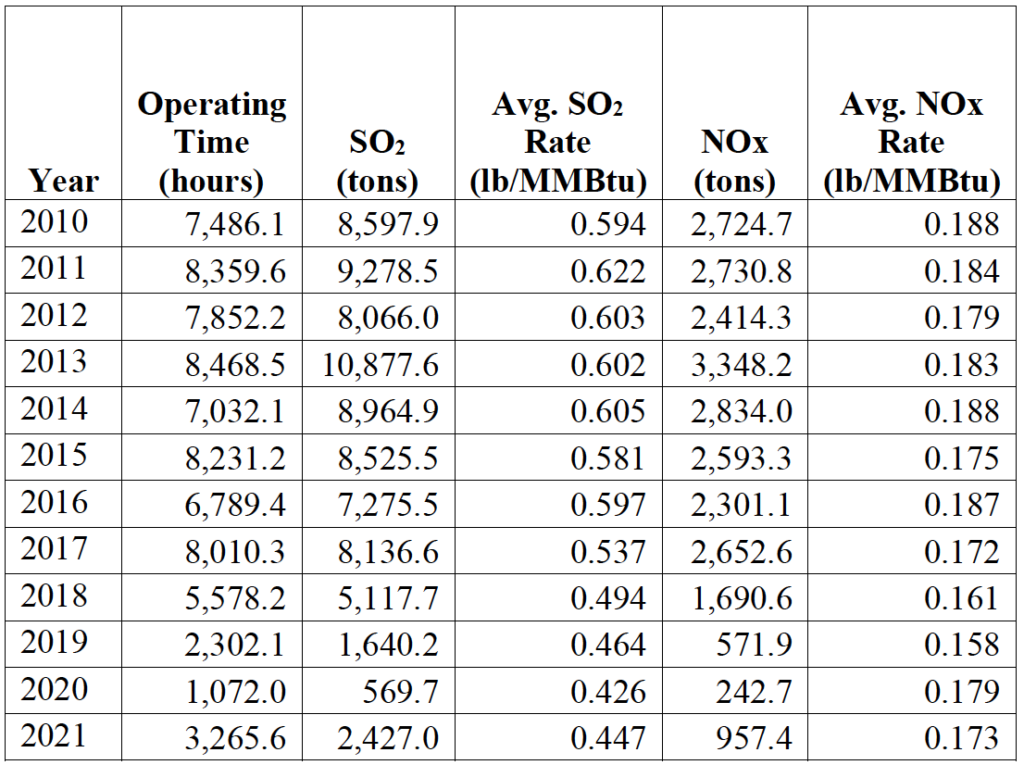
Rerunning the above cost-effectiveness calculations based on the data from individual years (as opposed to Trinity’s average of 2018-2019 data) results in the following:66See the file, “Hugo wetanddryscrubbers_controlcostmanualspreadsheet_may_2021-yearly.xlsm.”
Table 7. Hugo Unit 1 Wet and Dry Scrubber Cost-Effectiveness for Different Capacity Factors
| Year | Dry Scrubber Cost Analysis ($/ton) |
Wet Scrubber Cost Analysis ($/ton) |
| 2017 | $2,963 | $3,075 |
| 2018 | $4,486 | $4,697 |
| 2019 | $12,599 | $13,386 |
Obviously, 2020’s data would result in an even higher cost-effectiveness value. Therefore, after revising Hugo’s scrubber cost-effectiveness to correct the errors discussed above, ODEQ must make a determination in its SIP as to which data it finds is likely to be representative of future operations and make its four-factor determination on that basis.
As indicated above, Hugo’s DSI cost-effectiveness calculation relies on the same fundamentally flawed methodology of escalating a $/kW figure picked from another DSI cost analyses. As with the scrubber cost-effectiveness calculations detailed above, EPA has provided a DSI cost-effectiveness spreadsheet that has been in wide use since the first planning period.69See https://www.epa.gov/power-sector-modeling/retrofit-cost-analyzer. Note the Retrofit Cost Analyzer incorporates cost algorithms from EPA’s IPM cost models developed by S&L. These IPM cost algorithms, have been continuously updated since the first planning period. Therefore, Hugo’s DSI cost-effectiveness was calculated using the same basic inputs from the revised scrubber cost-effectiveness, along with the DSI efficiencies discussed above:70See the file entitled, “Hugo DSI Cost Estimate.xlsx.
Table 8. Hugo DSI with ESP Cost-Effectiveness
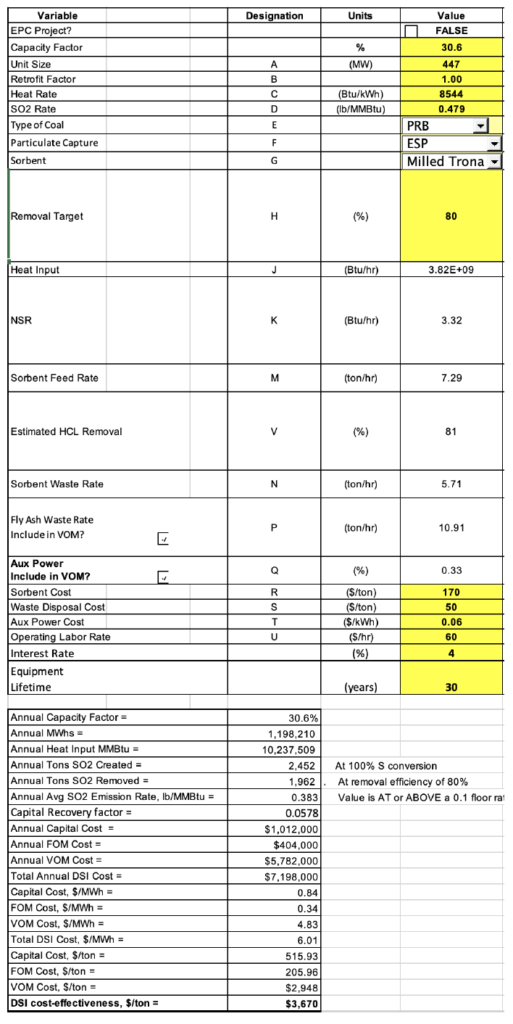
Because Hugo is fitted with an ESP, an ESP was selected as the particulate control device in the cost model. Thus, equipped with an ESP and assuming 80% efficiency, a DSI cost-effectiveness figure of $3,670/ton results. These figures are in 2016 dollars. Escalated to 2020, this figure become $4,039/ton.71The CEPCI index for 2016 is 541.7 and that for 2020 is 596.2. Thus, the figures are multiplied by the factor 596.2/541.7 = 1.10. This contrasts with the absurd value of $41,003/ton that Trinity presents. Even if, the unreasonably low DSI efficiency of 40% used by Trinity was adopted, the cost-effectiveness would still be $4,058/ton, which escalated to 2020 becomes $4,466/ton. Thus, ODEQ must require that Hugo revise its DSI cost-effectiveness and correct the errors described above.
11 Review of the Grand River Dam Authority Four-Factor Analysis
The Grand River Dam Authority operates the Grand River Energy Center (GREC) located in Mayes County. GREC comprises three units. Unit 1 was a 540 MW coal-fired dry bottom wall-fired unit that burned subbituminous coal, but is now retired. Unit 2 is a 594 MW coal-fired dry bottom wall-fired unit that burns subbituminous coal. This unit is fitted with NOx combustion controls and a dry scrubber. Unit 3 is a 600 MW natural gas-fired combined cycle unit. The four-factor report, which is present in Appendix E, is reviewed below.72Final Four Factor Analysis Grand River Energy Center Unit 2, prepared for Grand River Dam Authority by Black & Veatch, September 8, 2020. Hereafter referred to in this section as “the B&V report.”
The SO2 and NOx emissions for GREC Unit 2 are presented below:73See the file entitled, “OK EGU emissions.xlsx.”
Figure 2. GREC Unit 2 Historical Emissions

As can be seen from the above graph, starting in September 2012, the NOx emissions for Unit 2 significantly improved. Also, beginning in late 2015, the SO2 emissions for Unit 2 became erratic. There is no discussion for this in GREC’s four-factor analysis and ODEQ must require it, as it impacts that analysis.
11.1. GREC’s Four-Factor Report Is Fundamentally Inadequate
GREC’s four-factor report is fundamentally incomplete, as it lacks any details concerning the bottom-line cost-effectiveness figures it summarizes in Table 4-3. As a consequence, there is no way for any member of the public to fully assess GREC’s analysis. GREC’s undocumented figures rest on a thin claim of confidentiality.
On page 1-3 and 2-1, GREC’s redacts Unit 2’s historical capacity factor for 2016 and 2019, which is easily back-calculated based on public data present in EPA’s AMPD website and present in a spreadsheet attached to these comments.74See the file entitled, “OK EGU emissions.xlsx.” Therefore, there is no justification for this redaction.
GREC redacts 2019 emission data in Table 2-1, which again is public information and thus unjustifiable.
In Table 3-3, GREC redacts the maximum sulfur loading of Unit 2’s scrubber and on page 4-3 redacts the maximum sulfur content the scrubber can treat while functioning at an 85% efficiency. There is no conceivable commercial or competitive advantage to withholding this information, especially since GREC must report the sulfur percentage of the coal it does burn on a monthly basis to the Energy Information Agency, and this data is publicly available.75See https://www.eia.gov/electricity/data/eia923/.
In Table 3-2 GREC redacts what is indicates is its forecasted future capacity factor, which it apparently incorporated into its cost-effectiveness figures. GREC notes that its forecasted capacity factor “is not definitive; present circumstances and expectations suggest the potential value indicated. The increasing levels of renewables generation in the Southwest Power Pool mean that the current conditions for economic dispatch of coal-fired generation are not likely to change.”76Page 3-2 of the B&V report.
ODEQ correctly objects to GREC’s use of a forecasted capacity factor in its January 31, 2022 letter to GREC, requesting an explanation and explaining that if it is not based on recent historical operations, it may not be appropriate for GREC to base its four-factor analysis on it without an enforceable commitment to operate at that capacity factor.77See Appendix E, pdf page 74. GRCE simply replies in its February 28, 2022 letter that “[t]he forecasted capacity factor was based on recent historical operations of GREC from 2016-2020.” First, if this is actually the case, then there is no basis for GREC to redact its forecasted capacity factor, since as indicated above, historical emission data is public. Second, ODEQ is correct that unless GRCE is willing to enter into an enforceable commitment for a reduced capacity for Unit 2, then it must base its cost-effectiveness calculations on recent historical data, which again is public information and must not be redacted.
On page 7 and elsewhere of the B&V report, GREC redacts the life of Unit 2 on which its cost-effectiveness calculations were based. ODEQ correctly objects to GREC’s assumed short operating life in that same letter:
The assumption of a shortened remaining useful life in the cost analysis for controls evaluated for Unit 2 appears to be based on “operating projections.” As discussed in the August 2019 Guidance, this is not an appropriate approach. The Guidance explains that “In the situation where an enforceable shutdown date does not exist, the remaining useful life of a control under consideration should be full period of useful life of that control as recommended by EPA’s Control Cost Manual.” (See August 2019 Guidance at 34.)
In its reply, GRCE states the following:
The life of control equipment in the EPA Control Cost Manual, for example, provides a range, kg., 20 to 30 years for the assumed lifetime of a control device. It is arbitrary for EPA to force the use of one particular value within the range. The study was based on the most representative value based on known conditions at the time of the study. The GREC facility does not have an enforceable shutdown date. The useful life of the controls in consideration were developed based on GRDA’s understanding at the time of the unit’s remaining useful life.
As indicated elsewhere in these comments, GREC’s assertion that the equipment life is a flexible range from which a company can adopt any value it desires is wrong. Unless GREC is willing to enter into an enforceable commitment to the contrary, ODEQ must require that it base its cost-effectiveness calculations on a 30-year equipment life.
Also, in its January 31, 2022 letter to GREC, ODEQ again correctly requests that GRCE provide line-item cost calculations and any vendor quotes obtained for all the control options evaluated in the four-factor analysis. ODEQ points out to GREC that documentation of the technical basis of GRCE’s demonstration is a requirement of the Regional Haze Rule under 51.308(f)(2)(iii) (as noted several times throughout these comments). GRCE’s reply in its February 28, 2022 letter is that its analysis contains commercially sensitive information, such as economic criteria and cost calculations and on that basis asserts a confidentiality claim. GRCE further states that ODEQ is in possession of the unredacted version of its four-factor analysis.
ODEQ must formally review GRCE’s confidentiality claim. As indicated below, it appears that most, if not all of the redacted material should not be considered confidential. Furthermore, GREC’s general single-sentence claim that its entire cost-effectiveness analysis should be held confidential because it contains commercially sensitive information, such as economic criteria and cost calculations, is absurd. That same generalized claim could be asserted by every commercial source subject to a four-factor analysis. ODEQ must demand that GREC provide a substantially, if not entirely, unredacted cost-effectiveness calculations, or ODEQ must perform and present those calculations itself.
11.2. GREC Does Not Adequately Assess Scrubber Upgrades to Unit 2
The obvious path forward in GREC’s SO2 four-factor analysis for Unit 2 is to upgrade or optimize its existing dry scrubber. EPA has long recognized that scrubber upgrades are cost-effective. However, B&V minimizes this likelihood. For instance, on page 4-3, B&V states: “The current system was designed to remove 85 percent of the incoming SO2 based on the design information in Section 3, while burning coal with a sulfur content of up to [redacted] percent, so there is minimal potential for upgrades within the existing system to have a significant effect on SO2 removal.” B&V provides no documentation for this claim. ODEQ must require the following:
• Documentation that the scrubber system (as opposed to just the absorber) was designed to only remove 85% of the SO2 at the redacted sulfur content. ODEQ must investigate whether this efficiency figure includes a bypass, and whether this bypass can be partially or completely eliminated.
• Determination of the design scrubber efficiency for the coal GREC is currently burning.
• It appears from what discussion B&V does present, that it contemplates an SDA replacement and not an additional SDA module. ODEQ must clarify this and if the cost-effectiveness calculation in fact only considers replacement of the entire SDA system, ODQ must require that an additional SDA module also be considered.
• As indicated in the figure above that depicts GREC’s historical emissions, beginning in late 2015, the SO2 emissions for Unit 2 became erratic. Before this point, the SO2 emissions were much more tightly controlled. An examination of GREC’s coal sulfur data does not indicate any obvious change in the type of coal or the monthly coal sulfur content before or after this point, nor does it indicate any obvious change in the range of monthly sulfur content. ODEQ must require that this be investigated, as one obvious reason is that GREC’s scrubber system may not be properly operated or maintained.
12 Review of the OG&E Horseshoe Four-Factor Analysis
OG&E owns and operates the Horseshoe Lake Generating Station, located in Oklahoma County, Oklahoma. It consists of five units. Unit 6 is a 167 MW natural gas wall-fired boiler. Unit 7 is a 210 MW natural gas wall-fired boiler. Unit 8 is a 404 MW natural gas tangentially-fired boiler. Units 9 and 10 are both 45.5 MW simple cycle gas turbines. None of these units have any NOx controls beyond water injection for the Units 9 and 10. Two reports were reviewed consisting of a September 2020 Trinity report, which references a September 2020 S&L report, both of which are present in Appendix E.78Regional Haze Four-Factor Reasonable Progress Analysis, OGE, Horseshoe Lake Generating Station, prepared by Trinity Consultants, September 29, 2020. Hereafter referred to in this section as “the Trinity report.” OG&E Horseshoe Lake Station Unit 6-10, Regional Haze Second Planning Period Cost Evaluation to Support Four-Factor Analysis, Sargent & Lundy, September 28, 2020. Hereafter referred to in this section as “the S&L Report.” Graphs of the NOx emissions are not presented, as they do not indicate anything noteworthy.
Both S&L and Trinity’s SCR cost-effectiveness figures are flawed, due to similar issues described below regarding their SNCR cost analyses, and are quite inflated. However, these calculations are not reviewed herein because after applying EPA’s SCR Control Cost Manual cost model the resulting cost-effectiveness figures remain unfavorable.
12.1. OG&E’s SNCR Cost-Effectiveness Figures Are Greatly Inflated
S&L does not provide any documentation for the capital costs of its SNCR cost analyses for Units 6, 7, and 8, which Trinity uses to calculate cost-effectiveness figures of $24,528/ton, $36,107/ton, and $36,066/ton, respectively.79Note that Units 9, and 10 are not well suited to SNCR, as they are simple cycle combustion turbines. In so doing, S&L utilizes several improper parameters which inflate the cost-effectiveness. These include a contingency of 20%, a 20-year operating life, and a 7% interest rate. No documentation was provided for these parameters, and as discussed earlier in these comments, they are therefore improper and ODEQ must require that they be revised.
In addition, S&L bases its cost analysis on urea-based SNCR systems, which due to the cost of the reagent, result in much less favorable (higher $/ton) cost-effectiveness figures. For these reasons, primarily due to the lack of documentation and the inability to fundamentally adjust S&L’s cost analyses for ammonia-based SNCR systems, EPA’s SNCR Control Cost Manual cost model was employed to more reasonable calculate the SNCR cost-effectiveness for Units 6, 7, and 8.80See https://www.epa.gov/economic-and-cost-analysis-air-pollution-regulations/cost-reports-and-guidance-air-pollution. Section 4. The results of these calculations are contained in the file entitled, “Horseshoe SNCR CCM cost-effectiveness.xlsm The following tables summarize the result for 40% SNCR efficiency cases for Units 6, 7, and 8:
Table 9. Selected Input and Outputs Horseshoe Lake Unit 6, SNCR 40% Efficiency

Table 10. Selected Input and Outputs Horseshoe Lake Unit 7, SNCR 40% Efficiency

Table 11. Selected Input and Outputs Horseshoe Lake Unit 8, SNCR 40% Efficiency
 Cost-effectiveness $11,056 $/ton
Neither S&L nor Trinity provide any documentation for the SNCR efficiencies assumed in their calculations, simply assuming NOx outlet values of 0.15 lbs/MMBtu for Unit 6 and 0.12 lbs/MMBtu for Units 7 and 8. SNCR performance is in fact, very site-specific and it is difficult to predict without sophisticated modeling tools. However, the Control Cost Manual provides data that indicates a reasonable range is 40% to 60%.81See Control Cost Manual, Section 4 – NOx Controls, Chapter 1, Selective Noncatalytic Reduction, Revised 4/25/2019. Page 1-2 to 1-5. Therefore, the above SNCR cost models were also run using that range of efficiencies. Below is a summary of the results:
Table 12. Summary of SNCR Cost-Effectiveness for Horseshoe Lake Units 6, 7, and 8
| Unit | 40% | 50% | 60% |
| 6 | $4,209/ton | $3,538/ton | $3,083/ton |
| 7 | $5,409/ton | $4,545/ton | $3,960/ton |
| 8 | $11,056/ton | $9,172/ton | $7,898/ton |
As can be seen from the above summary, S&L and Trinity’s cost-effectiveness figures for SNCR are extremely inflated, even considering a modest SNCR efficiency of 40%. ODEQ must therefore reassess its determination that SNCR is not cost-effective.
13 Review of the DCP Chitwood Gas Plant Four-Factor Analysis
DCP Operating owns and operates the Chitwood Gas Plant, located in Grady County, Oklahoma. The plant runs nine compressor engines. C-1, C-2, C-3, and C-4 are 880-hp Cooper- Bessemer GMV-8 two-stroke lean-burn (2SLB) engines. C-5 is an 880-hp Clark HRA-8 2SLB. C-6 and C-7 are 1320-hp Ingersol-Rand KVS-8 four-stroke lean-burn (4SLB) engines. C-8 and C-9 are 1100-hp Cooper-Bessemer GMV-10 2SLB engines. ODEQ states that C-5, which has been out of service, will not be included in the Title V permit renewal, which is currently being reviewed. The four-factor report, which is present in Appendix E, is reviewed below.82Regional Haze Four-Factor Reasonable Progress Analysis, DCP Operating Co. Chitwood Gas Plant, prepared by Trinity Consultants, October 1, 2020. Hereafter referred to in this section as “the Trinity report.”
Controls evaluated include SCR and typical Low Emissions Combustion (LEC) controls. DCP obtained a vendor quote for the LEC from Siemens and an SCR system vendor quote from AeriNOx.83These quotes are attached to DCP’s four-factor analysis. The LEC controls could be provided with two basic options: a 1g/hp option and a 6g/hp option.84The vendor also provided a 2g/hp option for the KVS engines but this was not explored by Trinity. The 1g/hp option included a replacement electronic high pressure fuel injection system, a direct power cylinder peak firing pressure management system, modifying the heads to receive precombustion chambers, fuel injectors for the precombustion chambers and an upgraded turbocharger. The 6g/hp option included modification to the cylinder heads to receive precombustion chambers, fuel injectors for the precombustion chambers, and an upgraded turbocharger.
Chitwood’s SCR vendor indicated that it does not recommend that SCR systems be installed on uncontrolled engines (engines not already controlled to 6g/hp) due to a large variance in combustion instability and typically poor air/fuel ratio controls which can cause operational issues for the SCR system to function correctly. Consequently, SCR was only considered as an additional control after the 6g/hp LEC controls were already installed. Because the resulting 1g/hp equals the 1g/hp LEC option but at greater cost, it is not further considered in this review.
13.1. Chitwood Includes Undocumented Costs in Its Cost-Effectiveness Calculation
On page 24 (pdf) of its report, Trinity lists the cost of the equipment for the 1g/hp and 6g/hp options. Below is that information on a per-engine basis for the GMV-8 engines with the 1g/hp option. Costs for other engines are similar.
Table 13. Trinity’s Listing of Costs for Chitwood Engine Controls

Siemen’s quote does not contain any of the items below Item 1. In particular, the quote states, “The following pricing as mentioned above is for a full turnkey solution [emphasis added] and is budgetary only ‐ non‐binding for informational purposes only.” It does make some assumptions, some of which that are pertinent to this review are reproduced below:
a) Power cylinder heads do not have PCCs [precombustion chambers]; but they can be machined to accept PCCs.
b) Engines do not have turbochargers, or require replacement turbochargers to meet necessary air spec for NOx reduction.
c) Existing turbo pads are adequate for supporting the new turbocharger, its mounting structure and modification to piping.
d) Assume engines have PLC [programmable logic controller] based Unit Control Panels. Our controls will be placed in their own subpanel with HMI and set adjacent to existing unit control panels.
e) An engine health assessment will be performed on the engine by DCP Midstream or by Dresser‐Rand EASE program resources (charged at T&M rates) to verify engine operating condition and health prior to completing design work for the solution package.
f) Safety, inspectors, and fire watch personnel have not been included in this estimate.
Thus, there does not appear to be any requirement in the Siemens’ quote for Items 2, 3, 4 and 5. Regarding Item 2, intercoolers are an integral part of turbocharging systems and the Siemens’ quote indicates a “turnkey solution” and does not assume a separate intercooler installation by a third party. Regarding Items 3 and 4, the Siemens’ quote does not mention the need for replacement exhaust manifolds or updated air intake filters and housings. Regarding Item 5, the Siemen’s quote does not state the need for cylinder head replacement, and specifically includes modification of the existing heads for precombustion chambers. It is assumed that the vendor is familiar with the specific engines for which it is providing a quote. Regardless, GMV model cylinder heads have been modified to receive replacement precombustion chambers for many years.85Olsen, D. B., Adair, J. L., & Willson, B. D. (2005). Precombustion Chamber Design and Performance Studies for a Large Bore Natural Gas Engine. ASME 2005 Internal Combustion Engine Division Spring Technical Conference. Available here: https://www.researchgate.net/publication/267577761_Precombustion_Chamber_Design_and_Performance_Studies_for_a_Large_Bore_Natural_Gas_Engine Regarding Item 6, the Siemens’ quote does assume the existence of current PLC based Unit Control Panels, but specifically states that their own panels “will be placed in their own subpanel with HMI and set adjacent to existing unit control panels.” Programmable logic controllers have been in wide use in industrial environments for decades. Therefore, ODEQ must require that Chitwood justify the need for this $250,000 item, for each engine, which considering the information in the record, seems unlikely. Regarding Item 9, “Safety/inspector/fire watch for each engine build” is undocumented and $100,000 for each engine appears to be an excessive charge to have a worker standby with a fire extinguisher. It is difficult to understand how this cost could be higher than $56,250 cost for the project/site managers and engineer.
Regarding 12, there is no mention of the need for an oxidation catalyst in the Siemens’ quote. On page 2-2 of its report, Trinity states, “An oxidation catalyst will need to be installed in order to stay under current permit values, and the cost for this additional control is included in the cost control analysis.” Presumably this refers to potential increases in CO, which Siemens states in its quote could increase. However, Chitwood’s Title V Permit indicates that engines C-1 through C-8 are grandfathered:86Staff permit evaluation dated April 18, 2017, page 17, which precedes the actual permit: Part 70 permit, Permit No. 2016-1248-TVR3, DCP Operating Company, LP, issued April 20, 2017.
Based on emission calculations, this facility is a major source of HAP. Engines C-l through C-9 were constructed prior to December 12, 2002 and are therefore existing. However since the engines are all 4SLB & 2SLB engines with a site rating of more than 500 HP, the engines have no applicable requirements [emphasis added].
Specific Condition No. 6 further states, “Engine C-10 shall be operated with exhaust gases passing through a functioning catalytic converter.” Thus, it appears that engines C-1 through C-8 do not have any requirement “to stay under current permit values” as Trinity states above. ODEQ must therefore clarify the need to install oxidation catalysts, which Trinity lists for all the engines.
13.2. Chitwood’s Calculated Emissions and Emission Reductions Are Low
On page 2-2 of its Report, Trinity discusses how it calculated the baseline NOx emissions and the NOx emissions reductions from the controls it considered. Trinity states it only considered 2019 emissions and in order to account for year-to-year variability, and to provide a more accurate assessment of potential reductions, the 2019 emissions were equally redistributed for each engine type and each engine service. It states that detailed calculations are in Appendix A. However, there are not any detailed emissions calculations in Appendix A, beyond a factor termed “DRE %,” which appears to represent a percentage emission reduction.
Because the emissions reported to ODEQ are in tons and the controlled emission rate from the vendor is in g/hp, a direct verification of Trinity’s calculations cannot be made without additional information. ODEQ must require that Chitwood document and justify its emission reduction factor. This is a requirement of the Regional Haze Rule under 51.308(f)(2)(iii) (as noted several times throughout these comments).
Even though its controlled emission rate cannot be verified, Chitwood’s baseline emission were examined, using information provided by ODEQ via a public information request.87This is why this type of data is a necessary part of the SIP. The information below contrasts Trinity’s emission reduction calculation with a revised version, that simply averaged the individual engine emissions from 2018-2020:88See the file entitled, “Chitwood cost-effectiveness.xlsx.”
Table 14. Revised Chitwood Engine Emissions


As can be seen from the above, in most cases the revised emissions were above those calculated by Trinity. Again, ODEQ must require that Trinity justify its calculations.
13.3. Chitwood’s Cost-Effectiveness Figures Are Inflated
In addition to the issues described above, Trinity uses an undocumented 7% interest rate. As with other undocumented interest rates discussed in these comments, it has been revised to the current Bank Prime rate of 4% in the revised cost-effectiveness that follows. Note that some details of these calculations are omitted for space constraints here but are available:89See the file entitled, “Chitwood cost-effectiveness.xlsx” for all details related to this calculation.
Table 15. Revised Chitwood Engine Cost-Effectiveness Figures

As can be seen from the above revised summary, Chitwood’s cost-effectiveness is inflated and is approximately double what it should be, based on the issues noted above. These figures may improve further, depending on Trinity’s NOx emission calculation.
On page 2-5 of its report, Trinity makes various arguments related to the cost of the controls. ODEQ should consider, as noted above, that these engines, with the exception of C-9, have escaped permitting limits for decades due to being grandfathered into the program. LEC controls have been regularly found to be cost-effective for many years across the United States and there is a great deal of information available to support this conclusion. For instance, in 2000, EPA calculated LEC cost-effectiveness figures for lean burn engines of $404/ton to $530/ton, depending on the efficiency, and for SCR of $1,066/ton.90See NOx Emissions Control Costs for Stationary Reciprocating Internal Combustion Engines in The NOx SIP Call States, E.H. Pechan & Associates, Inc, Revised Final Report, August 11, 2000. Available here: https://www.epa.gov/economic-and-cost-analysis-air-pollution-regulations/cost-reports-and-guidance-air-pollution. Page 17. A more recent 2015 EPA publication lists the cost of LEC for lean burn compressor engines as $649/ton.91Technical Support Document (TSD) for the Cross-State Air Pollution Rule for the 2008 Ozone NAAQS Docket ID No. EPA-HQ-OAR-2015-0500, Assessment of Non-EGU NOx Emission Controls, Cost of Controls, and Time for Compliance, U.S. Environmental Protection Agency Office of Air and Radiation November 2015. Page 13. Available here: https://www.epa.gov/economic-and-cost-analysis-air-pollution-regulations/cost-reports-and-guidance-air-pollution. Even more recently, the NPCA commissioned a comprehensive report on reasonable progress four-factor control analysis for the oil and gas industry.92Assessment of Cost Effectiveness Analyses for Controls Evaluated Four – Factor Analyses for Oil and Gas Facilities for the New Mexico Environment Department’s Regional Haze Plan for the Second Implementation Period, July 2, 2020, Prepared for National Parks Conservation Organization by Vicki Stamper & Megan Williams. This study cites many examples of LEC for engines similar to those used by Chitwood, resulting in much lower cost-effectiveness figures.
14 Conclusion
We urge ODEQ to reevaluate its Draft SIP especially in light of EPA’s July 8, 2021 Clarification Memo and these comments, which confirm that the Draft SIP is fundamentally flawed. Due to the deficiencies outlined above and in the attached and referenced exhibits, the state must revise and reissue a valid regional haze SIP for public notice and comment. Please do not hesitate to contact us with any questions or to discuss the matters raised in these comments.
Respectfully submitted,
Sanjay Narayan
Managing Attorney
Sierra Club
2101 Webster St., Suite 1300
Oakland, CA 94612
sa************@********ub.org
Chloe Crumley
Field Representative, Texas and Oklahoma
National Parks Conservation Association
6705 W Highway 290, Suite 50261
Austin, TX 78735
cc******@**ca.org
Michael B. Murray
Chair
Coalition to Protect America’s National Parks
2 Massachusetts Ave NW, Unit 77436
Washington, DC 20013
ed****@********ps.org
CC (via email):
Earthea Nance, Regional Administrator, EPA Region 6, Na***********@*pa.gov
David Garcia, Director, Air and Radiation Division, EPA Region 6, Ga**********@*pa.gov